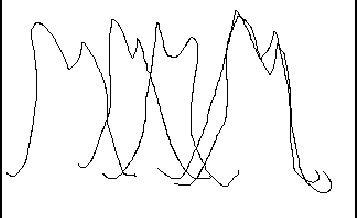
I'm a little confused about your plots. You say it is a time series plot, yet there are several places where your rises and falls "bend backward" so they aren't functions at all. I assume time is not going backward at those moments, so are these complex plane plots?
Disregarding that for a moment. You have a characteristic shape, so I think your best approach is to extract some characteristic values and use those for your comparisons. Prior to doing that, I would also recommend that your "smooth" your shapes to reduce the impact on any noise/jaggedness in your data.
Assuming they are a time series, x[n], with evenly in time sampled points, I would run a differentiating filter on them and locate the three points the define the top of the "M". It also looks like you have a local minimum ahead of the initial rise and one following the terminal fall. Locating those will give you five calibration points for each graph to align them along the x axis. The best displacement value can be found by doing a least squares fit. If they need to be rescaled, it get a little bit more complicated, but still doable.
Same is true for vertical rescaling.
For the smoothing and differentiating, my technique of choice is to do a forward exponential smoothing, a backward exponential smoothing, then average the two for a smoothed function, and subtract the forward from the backward to get a smoothed "derivative". It's not exactly the derivative, but close. Details in this article of mine:
Basically, any smoothing or differentiating technique you choose should work as you are looking for characteristic values and as long as you apply the same approach to each graph you will get consistent compare-able results.
If you are looking to find parametric equations that define your characteristic shapes, then want to compare parameters, that's a different topic. If you do, I would align them as much as possible on the location of characteristic points first for better results. Fourier series would be good for that.
That should get you started.
Ced

