I am trying to work on a polyphase passthrough design, where each ADC and DAC are sampled at 2.048 GSPS and the decimation @ ADC is set to 8 so that the FPGA fabric clock is set @ 256 MHz. The same level of interpolation is applied to the DAC. But when I am trying to input a signal @ 1000 MHz I am getting an "aliased" signal @ 1048 (2048 -sampling freq minus 1024 - center freq). This behavior is consistent through 800 MHz. I understand that to avoid aliasing I should sample at a frequency twice the center frequency which is par with my experiment. I am open to an opinion on this matter from the community. Thank you
-
$\begingroup$ What digital LPF are you using for decimation? $\endgroup$– Yair MCommented Oct 17 at 6:03
-
$\begingroup$ I am using the available ADC/DACs in the ZCU1275 RFSoC $\endgroup$– MIchaelNilanCommented Oct 17 at 10:34
-
$\begingroup$ The RFSoC implements various digital LPFs which may be cascaded. This is configurable. If I remember correctly, details appear in PG269. The filter taps appear there too, and you can plot the frequency response in MATLAB $\endgroup$– Yair MCommented Oct 18 at 6:00
-
$\begingroup$ @YairM Thank you for the info will check surely $\endgroup$– MIchaelNilanCommented Oct 21 at 14:43
1 Answer
I believe the OP's confusion is in understanding how aliasing (with and ADC) and imaging (with a DAC) occurs, so I will provide some more details that provide more intuition there first.
Images when doing D/A Conversion
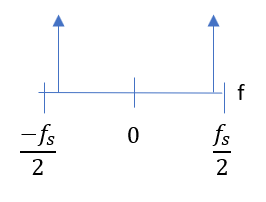
Below is the two-sided spectrum of a digitized sinusoid where the frequency sampled is close to Nyquist ("Nyquist is half the sampling rate, labeled here as $f_s/2$).
Over this first Nyquist Zone (which is the frequency range from $-f_s/2$ to $+f_s/2$ for a two-sided spectrum) the spectrum is uniquely defined, and when the signal is real the spectrum will also be "complex conjugate symmetric" which means the spectrum for the positive frequency axis will have the same magnitude as the negative frequency axis, so basically a mirror of it as plotted above and then unique from DC to $f_s/2$. So far this is consistent with what we would find is the Fourier Transform of a sinusoid.
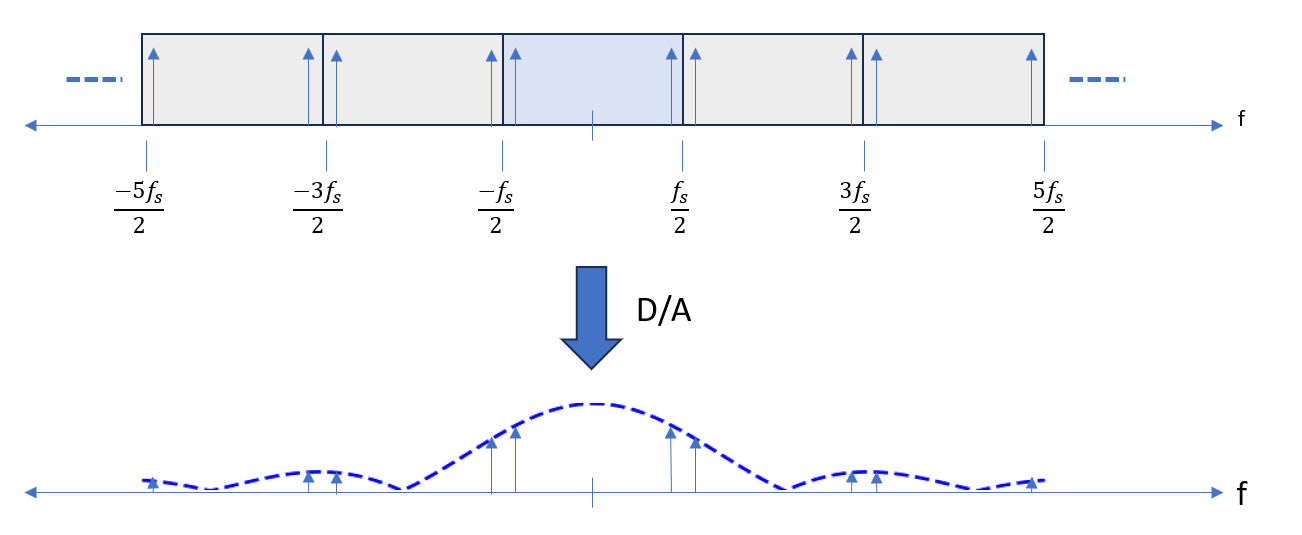
However, if we were to extend the frequency axis further, we would find that the digital spectrum is periodic, and specifically everything that appears from $-f_s/2$ to $+f_s/2$ will repeat exactly in every higher multiple of the same range (so every multiple of $(N-1) f_s/2$ to $(N+1) f_s/2$ for every $N$.
This is still the digital spectrum, we haven't yet considered converting this to an analog signal as we would do with a D/A converter. The digital spectrum is indeed periodic when considered over a frequency span extending beyond Nyquist, but because it redundantly repeats exactly as it appears in the first Nyquist zone, we would typically just show a spectrum over the first Nyquist zone (or even just DC to Nyquist for real signals) as that conveys all the relevant information. However the periodic extended spectrum does provide an intuitive model for understanding and quantifying aliasing and imaging in A/D, D/A conversion as well as multi-rate signal processing (as done with a polyphase filter implementation).
That said, let's now consider the D/A process specifically with a traditional D/A converter which does a sample and hold operation on each digital output value (staircase reconstruction). The holding of a value is a low pass filter operation within itself, and specifically has a Sinc shaped response to the signal being processed. The the D/A will take the extended digital spectrum and convert it to analog as indicated in the graphic below:
So here we see how the periodic digital spectrum becomes images in the D/A output and where those images will be specifically, and we also see how the stair-case reconstruction will work as a low pass filter attenuating not only the images, but also signals within the primary Nyquist zone if they are closer to Nyquist.
This specifically explains how when the OP creates a digital 1 GHz tone at a sampling rate of 2.048 GHz (Nyquist = 1.024 GHz) there will be a strong image (close to but less than the level of the 1 GHz tone) at 1.048 GHz. As the 1 GHz tone is lowered by $x$ Hz, the image will be higher by $x$ Hz with an increase in roll-off consistent with the graphic above.
Ultimately an analog reconstruction filter is required to pass the signals of interest but reject these image frequencies that exist from the digital spectrum. The more margin we can allow in keeping our maximum signal away from Nyquist, the easier it will be to realize the necessary analog filter.
The same thinking applies to the polyphase up-sampling, where the OP is ultimately generating signals with a much lower sampling rate of 256 MHz. The signal generated in this lower frequency range from -128 MHz to +128 MHz will be periodic and thus we can creatively create a bandpass filter (using polyphase structures) to select the higher image in the 1 GHz range once this signal is interpolated to the higher rate (the polyphase structure effectively does just this while always operating at the lower rate). In the end a 1 GHz tone is created with the images as introduced above.
Aliasing in A/D Conversion
As for the process of aliasing that happens in an A/D conversion, please see DSP.SE #91854 where I have provided further details in explaining how that occurs. Because of this, an analog anti-alias filter is always required prior to the A/D Converter input, and as similar to the D/A consideration, the more margin we can allow in keeping our maximum signal away from Nyquist, the easier it will be to realize the necessary analog filter.
Images and Aliasing specific to OP’s implementation
If you sample a real signal with sampling rate $f_s$, then any frequency above Nyquist ($f_s/2$) will alias (or fold) back onto the frequency range extending from DC to $f_s/2$ according to:
$$f_{fold} = f_s - f_{in}$$
(as an alias when $f_s/2 < f_{in} < f_s$ and folds similarly as the input extends higher in frequency crossing each additional Nyquist zone boundary spaced by $Nf_s/2$. An analog anti-alias filtering is always required ahead of the A/D conversion).
So in the OP's case the sampling rate is $f_s = 2.048e6$, and if $f_{in} = 1.048e6$, which is greater than $f_s/2 = 1.024e6$, then $f_{fold} = f_s - f_{in} = 2.048e6 - 1.048e6 = 1.024e6$.
The same process happens at the same frequencies for D/A conversion (with the additional Sinc shaped attenuation due to DAC reconstruction). If we created a 1 GHz output signal, with the DAC sampled at 2.048 GHz, there would be a copy of the 1 GHz tone at $f_s/2 + (f_s/2 - 1e6) = f_s - 1e6 = 1.048e6$. This too would be very challenging for the analog reconstruction filter after the DAC to pass the 1 GHz desired signal and reject the image at 1.048 GHz.
Ultimately, polyphase or otherwise, the sampling rate is likely too low to process a signal with a frequency at 1 GHz. Typically I use about 30% margin to allow for realizable analog filters. (With that $f_s > 2.5$ GHz is recommended unless you have a high performance analog filter already selected that can satisfy a tighter requirement).
As far as the polyphase details, to confirm I understand the OP’s intent:
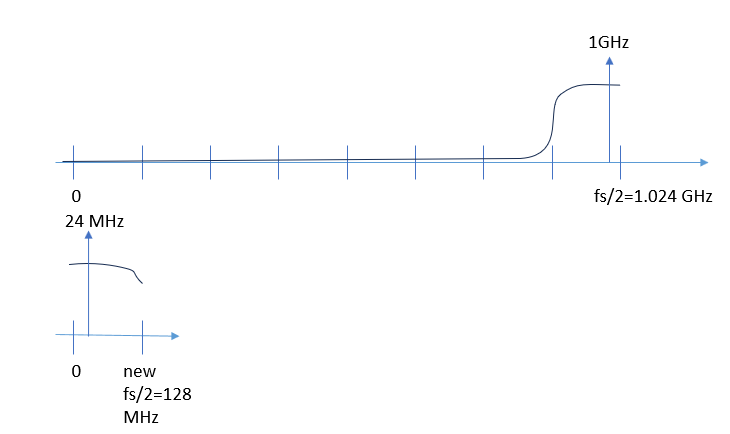
In order to create a polyphase filter where you pass a 1 GHz signal with a 2.048 GSPS sampling rate with the decimation set to 8 is if your prototype filter coefficients for the polyphase should be a highpass filter passing the frequencies from 896 MHz to 1.024 GHz. Even with that you have very little margin to the Nyquist folding frequency at 1.024 GHz. What this means is the implementation will properly translate a 1 GHz input to the 24 MHz output at the decimated rate of 256 MHz, but an input signal at 1.048 GHz will also be translated to 24 MHz (so a very tight anti-aliasing filter is required at the input to the ADC to pass 1 GHz but reject 1.048 GHz and prevent this aliasing distortion; even if it was just the amplified noise floor at the aliasing frequency location, it would be still be a bad design choice for the receiver sensitivity as a 3 dB noise figure increase would result just because of this.)
I made a sketch to confirm that I am properly understanding the OP's intent. If this is not what is intended, please update the question to provide a block diagram of the intended polyphase filter and it's purpose.
-
$\begingroup$ Doesn’t the OP state that he sees the phenomenon also at 800MHz which is within the first Nyquist zone? However, the OP states he uses decimation. I guess aliasing occurs due to the specifics of the digital LPF $\endgroup$– Yair MCommented Oct 17 at 6:00
-
$\begingroup$ @YairM 800 MHz is within the 7th Nyquist zone of the output decimated rate. That decimation is just like another A/D conversion (A/D is resampling from an infinite sampling rate to the 2.048 GHz rate. And then the decimation is resampling from 2.048 GHz to 256 MHz rate -- -all anti-aliasing considerations for filtering ahead of that downsampling apply the same as we would consider with the A/D converter. So if he has a high pass from 896 GHz to 1.024 GHz as I show as part of that polyphase, that high pass needs to pass > 896 GHz but reject 800 MHz. $\endgroup$ Commented Oct 17 at 9:55
-
$\begingroup$ @DanBoschen Thank you for your detailed answer. I have no control over the filters as I am using the available ADC and DACs in ZCU1275 RFSoC for this purpose. I understand that the sampling rate is too low to achieve a higher bandwidth for the pass through design. However, I am limited by the given sampling rate for now. $\endgroup$ Commented Oct 17 at 10:38
-
1$\begingroup$ @DanBoschen Could you be able to provide me a graphical explanation? I am not using any filters prior to the supply of the signal and after the ZCU1275. $\endgroup$ Commented Oct 17 at 14:38
-
1$\begingroup$ Great, glad it was clear. The whole polyphase thing really complicates it, but if you dig through that you'll recognize that the exact same thing is occuring. Rate conversion in digital to digital is the same as going from analog to digital and the "extended frequency axis" view I use really helps a lot in providing intuition about that. $\endgroup$ Commented Oct 17 at 17:29


