2
$\begingroup$

I have a simple signal chain with a differential sinusoid as the input. This passes through the first amp which converts the signal to a single ended signal. The next block is a 4 pole low pass filter with an Fc~100kHz. After this LPF I have my ADC. My ADC is sampling at 500ksps.

(input signal 100kHz differential) -> (instrumentation amp) -> (LPF 100k Fc) -> (500ksps ADC)

I know I don't have a lot of oversampling (5 samples per period in this example), but I'm seeing 5Hz oscillations in the data and I'm trying to understand exactly what is going on since my LPF when measured with an oscilloscope seems to be working great. It seems with 5 samples per period there isn't enough data to re-create the signal very well but it is interesting that the frequency I'm seeing appear as an error is 5Hz which is my sample rate divided by my input signal frequency (500kHz/100kHz).

This is probably something obvious, but in reading about anti-aliasing all I see is problems due to under sampling and not having a LPF. Does anyone know what is going on here and what topic I should research to get a better handle on this?

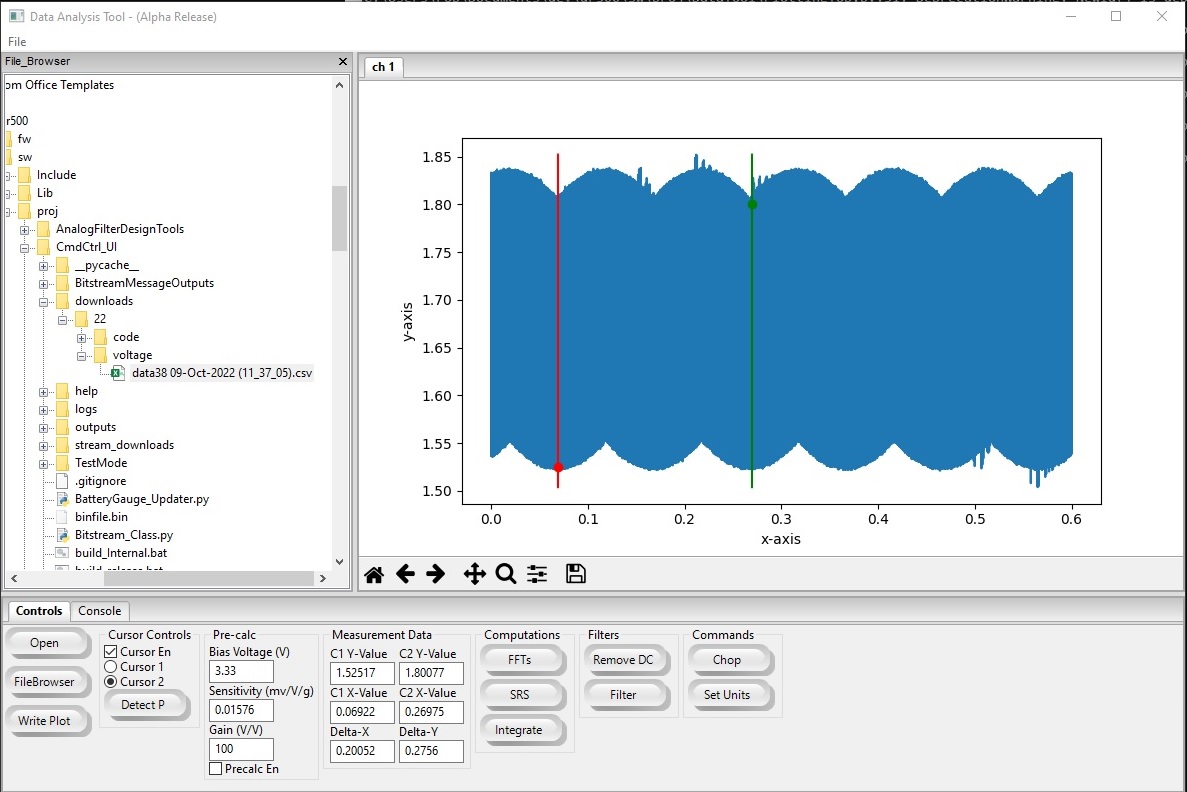
Below is a picture of the datafile showing the high frequency sine wave riding on the 5Hz sinewave which I don't want. In this screenshot you can see the cursors marking an oscillation period of 200mS. This is shown in the software box labeled "Delta-X". enter image description here
$\endgroup$
1
  • $\begingroup$ Just a note: if you ask a filter design program for a 4th-order 100kHz filter, you'll get a filter with a cutoff frequency of 100kHz. This term can be confusing for newbies -- it's the frequency where the filter is transitioning from passing your interesting signal to where it's blocking it. For your purposes, it's neither fish nor fowl. You probably want a bandpass filter centered around 100kHz, but that depends on your signal and what you're doing with it. It may be a good idea to ask a separate question about that. $\endgroup$
    – TimWescott
    Commented Oct 10, 2022 at 4:09

1 Answer 1

3
$\begingroup$

Most likely, your signal isn't exactly 100kHz or your sampling rate isn't exactly 500kHz -- with a mismatch of 5Hz.

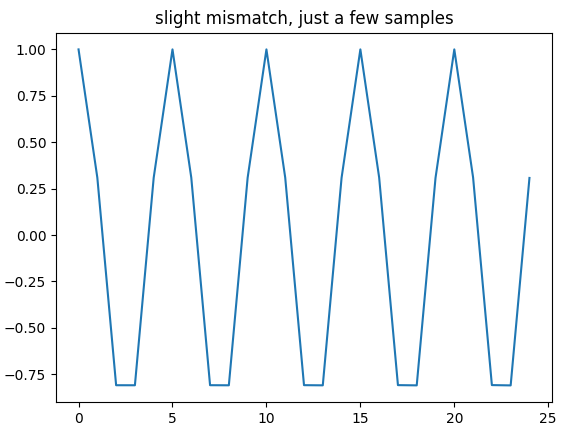
I made a signal $x_n = \cos\left(2 \pi \frac{99995}{500000} n\right)$. Here's what the first 25 points look like:

enter image description here

Note that the peak of the signal is pretty much equal to 1. But the anti-peak is only -0.8 or so (you ought to be able to work out what it actually is). This is because the sampling rate is just 5 times higher than the signal. All the information is there, but just reconstructing it with a graphing program has artifacts.

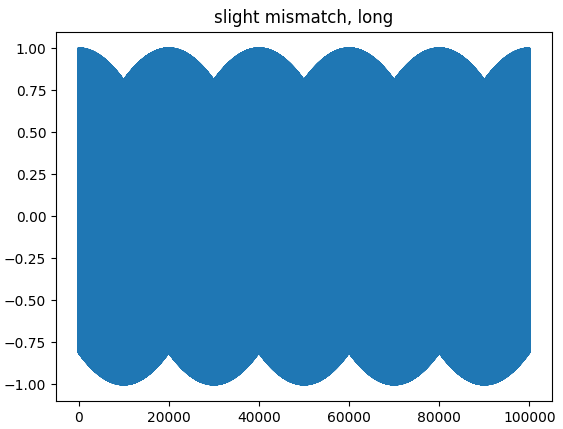
Also, because the signals are mismatched, over time the peak and the anti-peak will vary. Here's what the first 100,000 points look like:

enter image description here

Look familiar?

What you're seeing isn't because your signal and your sampling rate happen to be separated by a factor of five. It's because there's a 5Hz difference between them, someplace, and that's interacting with the artifact of the way that you're graphing the signal.

$\endgroup$
4
  • 2
    $\begingroup$ The artifact should disappear if the plotting would be using sinc interpolation (or resampling to higher samplerate before plotting) instead of simple linear interpolation. $\endgroup$
    – jpa
    Commented Oct 10, 2022 at 11:37
  • 1
    $\begingroup$ Hi Tim - thank you for the reply this has really helped point me in the right direction. One quick follow-up question. Should this 5Hz show up in the FFT and does this datafile (current discrete waveform) need to be further processed or is it fine as is (as you may have implied by "all the information is there"? Say for example if this were a sensor output for shock/vibration. $\endgroup$ Commented Oct 10, 2022 at 17:52
  • $\begingroup$ Stackexchange is different from other fora -- it wants nicely stated questions with nicely stated answers, with comments reserved for side issues or clarification. In this case, I think those two questions are more than closely related enough to your main question that you should edit your question to include them. Then I'll edit my answer, or someone else will give you an answer that includes answers to those questions. (Or, alternately, ask another question, referring to this one). $\endgroup$
    – TimWescott
    Commented Oct 10, 2022 at 21:37
  • $\begingroup$ Hi Tim, I think I will leave this as is for now. I will continue to work on this and if need be post a new question about a specific issue with supporting data as my last question was fairly vague. Thanks! $\endgroup$ Commented Oct 13, 2022 at 6:06

Your Answer

By clicking “Post Your Answer”, you agree to our terms of service and acknowledge you have read our privacy policy.

Not the answer you're looking for? Browse other questions tagged or ask your own question.