1
$\begingroup$

I am trying to verify for myself that aliasing actually makes it impossible to distinguish the "real" and the aliased frequency. What I have done it set the sampling rate to 20 Hz and created two sine wave with 2 Hz and 18 Hz. As far as I understand the 18 Hz signal should alias to a 2 Hz signal when the sampling rate is 20 Hz.

Matlab code:

t = [0:0.05:1];      //20Hz sampling
a = sin(2*pi*2*t);   //2Hz sine wave
b = sin(2*pi*18*t);  //18Hz sine wave
plot(t, a);
hold on;
plot(t, b, 'red');

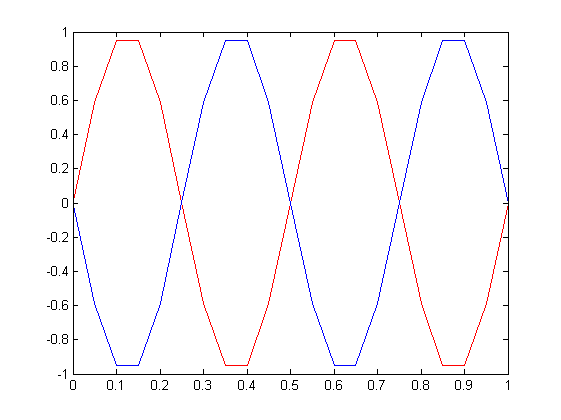
The plot looks like this:
enter image description here

I can see that both sine waves are equal, but 180 degrees out of phase. I wonder if there is something to it or if it's just Matlab drawing through the points in opposite ways?

$\endgroup$
2
  • $\begingroup$ possible duplicate of Demonstrating the effect of aliasing $\endgroup$
    – jojeck
    Commented May 20, 2014 at 20:59
  • $\begingroup$ @jojek: Might be, but did not help me. I also have a very specific question. $\endgroup$ Commented May 20, 2014 at 21:06

3 Answers 3

3
$\begingroup$

Yes, there is something to it. The phase increment of each sample of the 2 Hz wave is $2\pi * 2*.05=.2\pi$. The phase increment of each sample of the 18 Hz wave is $2\pi*18*.05=1.8\pi=-.2\pi$. Thus, the 2 Hz wave is $sin(2\pi*2*t)$, and the 18 Hz wave is $sin(2\pi*-2*t)=-sin(2\pi*2*t)$. Thus, the two waves are 180 degrees out of phase.

$\endgroup$
5
  • $\begingroup$ I did not quite understand how the 18 Hz has negative phase increment? $\endgroup$ Commented May 20, 2014 at 21:53
  • $\begingroup$ Could one then use the phase information to distinguish between the aliased and the non-aliased frequency assuming no frequencies above Fs is present? $\endgroup$ Commented May 20, 2014 at 22:05
  • $\begingroup$ @Phataas Phase, or angles, are circular. 0 radians is the same as $2\pi$ radians is the same as $4\pi$ radians... Thus, $1.8\pi$ radians is the same as $1.8\pi - 2\pi = -.2\pi$ radians. $\endgroup$
    – Jim Clay
    Commented May 21, 2014 at 3:06
  • $\begingroup$ @Phataas No, you can't really use the phase information to distinguish between aliased and unaliased tones. For one thing, there are unaliased negative frequencies. For another, the whole point of the aliasing is that you can't know, without a priori information, if it is -2 Hz or 18 Hz or 38 Hz or -22 Hz, or any other possible alias. They all look exactly the same. $\endgroup$
    – Jim Clay
    Commented May 21, 2014 at 3:09
  • 1
    $\begingroup$ I would appreciate an explanation for the -1 so I can either respond or fix the answer. $\endgroup$
    – Jim Clay
    Commented May 24, 2014 at 1:44
4
$\begingroup$

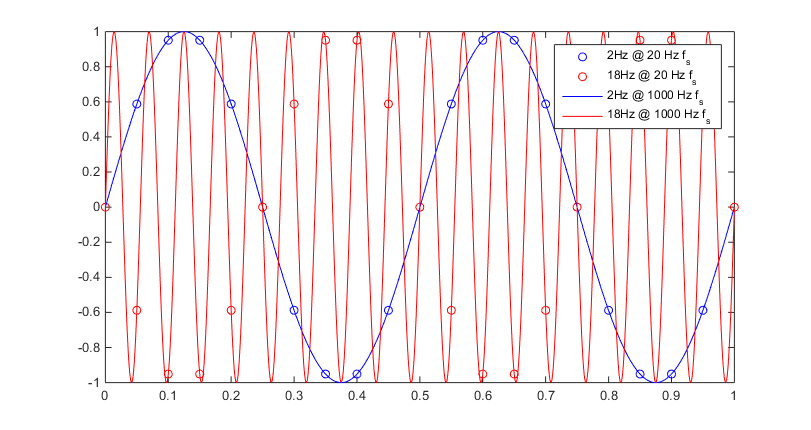
I think you should plot something like:

t = [0:0.05:1];      %20Hz sampling
a = sin(2*pi*2*t);   %2Hz sine wave
b = sin(2*pi*18*t);  %18Hz sine wave
plot(t, a, 'bo');
hold on;
plot(t, b, 'ro');

T = [0:0.001:1];     %1000Hz sampling frequency
A = sin(2*pi*2*T);
B = sin(2*pi*18*T);
% plot for 1000Hz sampling frequency
plot(T, A, 'b');
plot(T, B, 'r');

legend({'2Hz @ 20 Hz f_s', '18Hz @ 20 Hz f_s', '2Hz @ 1000 Hz f_s', '18Hz @ 1000 Hz f_s'})

That allows to understand which exact samples of your sinusoids you are taken at a given sampling frequency:

enter image description here

$\endgroup$
2
  • $\begingroup$ You mean 1000 Hz instead of 100 Hz? $\endgroup$ Commented May 20, 2014 at 21:39
  • 1
    $\begingroup$ @Phataas: Yes, I am sorry - to much cognac for todays evening ;) Post edited. $\endgroup$
    – jojeck
    Commented May 20, 2014 at 21:48
2
$\begingroup$

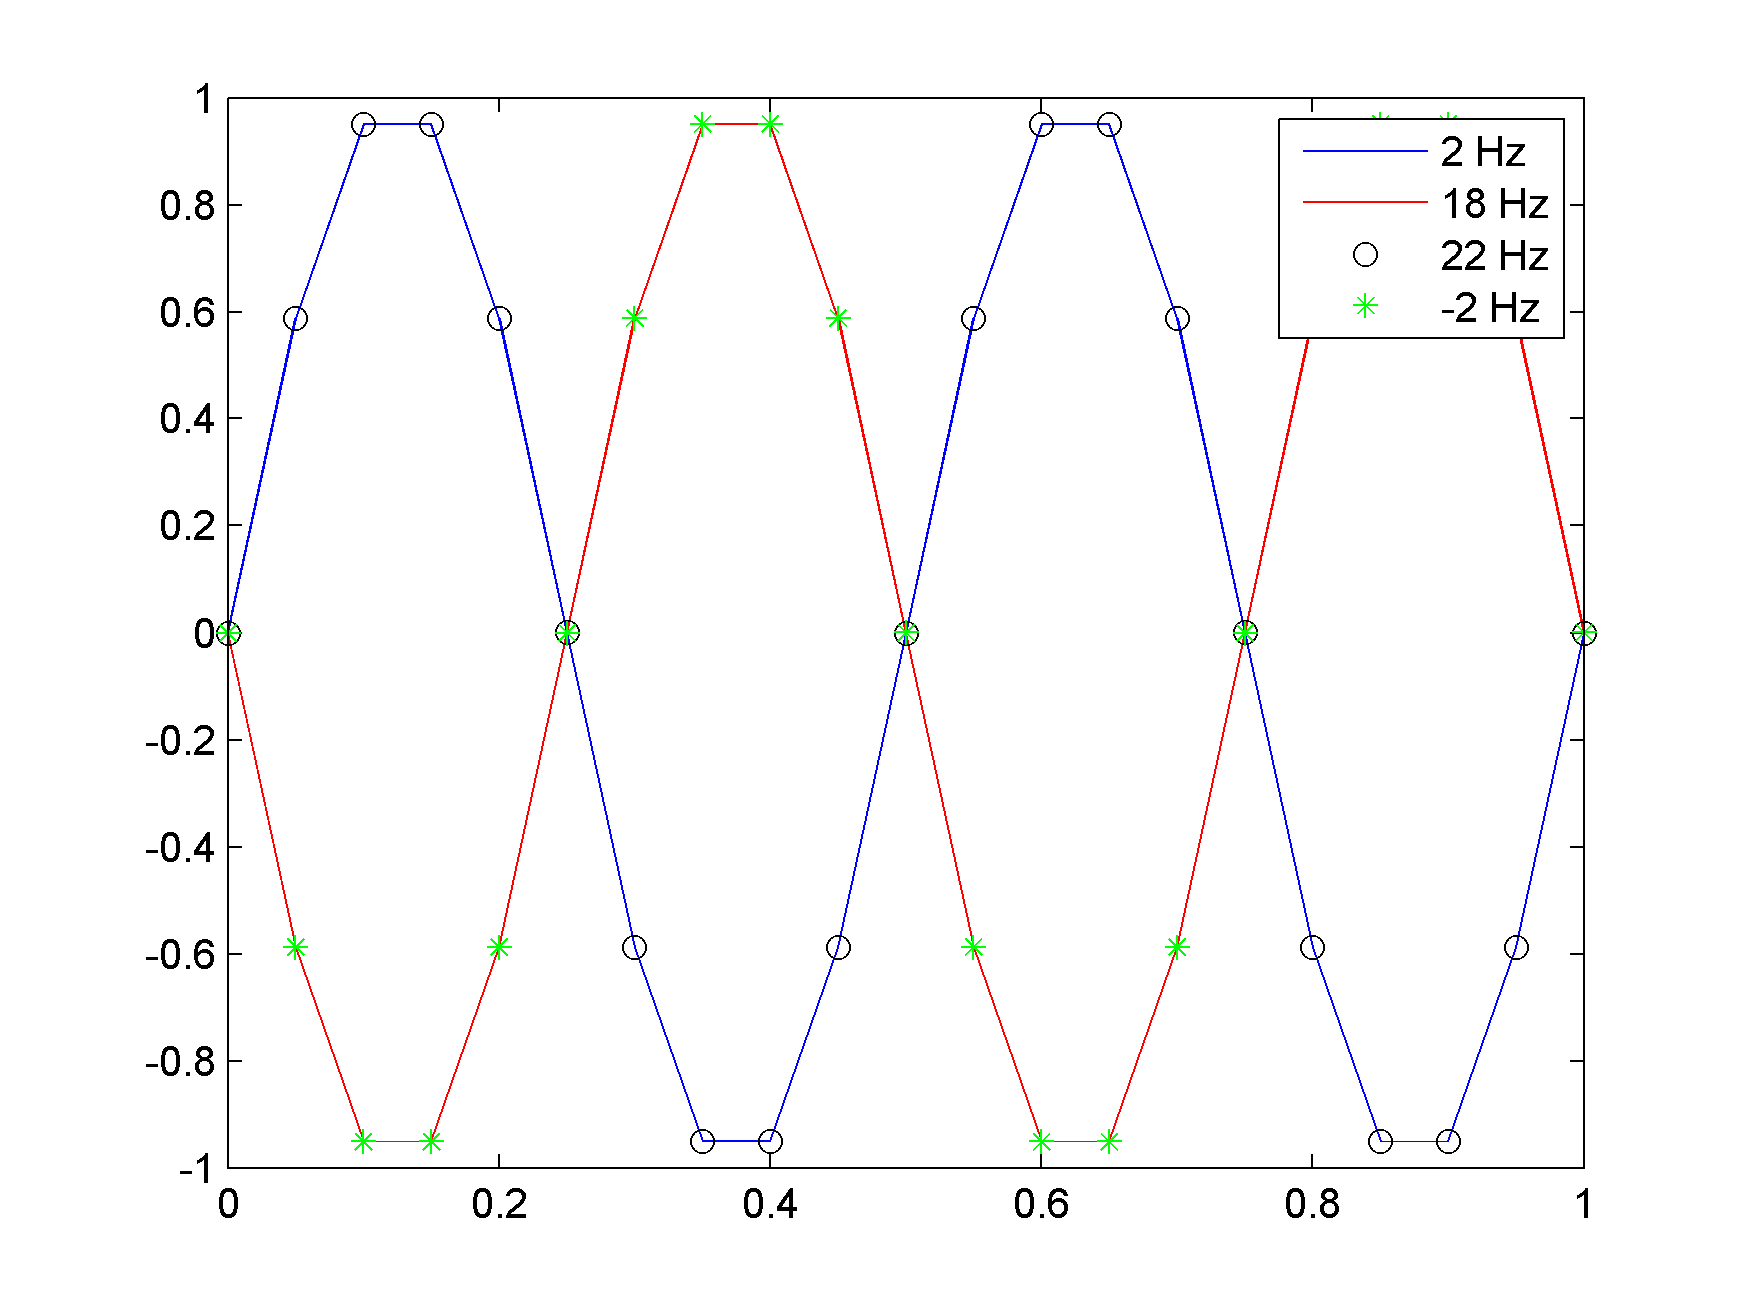
That's expected because an 18 Hz tone sampled at a 20 Hz sample rate is equivalent to a -2Hz tone.

Think about how it would look if DC was re-centered up at 20 Hz. 18 Hz would be on the low side.

t = [0:0.05:1];      %20Hz sampling
a = sin(2*pi*2*t);   %2Hz sine wave
b = sin(2*pi*18*t);  %18Hz sine wave
c = sin(2*pi*22*t);  %22Hz sine wave
d = sin(2*pi*-2*t);  %%-2Hz sine wave
plot(t, a);
hold on;
plot(t, b, 'r');
plot(t, c, 'ko');
plot(t, d, 'g*');
legend('2 Hz','18 Hz','22 Hz','-2 Hz')

enter image description here

$\endgroup$
2
  • $\begingroup$ Hmm, not sure why I was downvoted :/ $\endgroup$ Commented May 20, 2014 at 21:29
  • 1
    $\begingroup$ Neither am I, this looks reasonable. $\endgroup$
    – Phonon
    Commented May 20, 2014 at 21:38

Your Answer

By clicking “Post Your Answer”, you agree to our terms of service and acknowledge you have read our privacy policy.

Not the answer you're looking for? Browse other questions tagged or ask your own question.