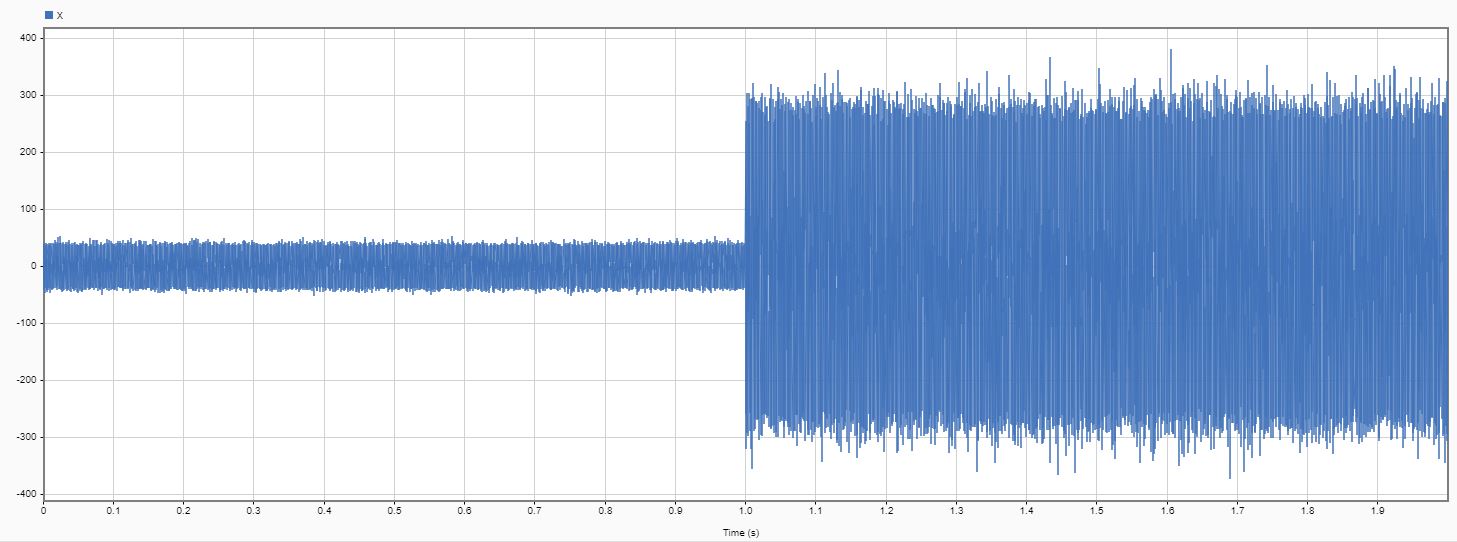
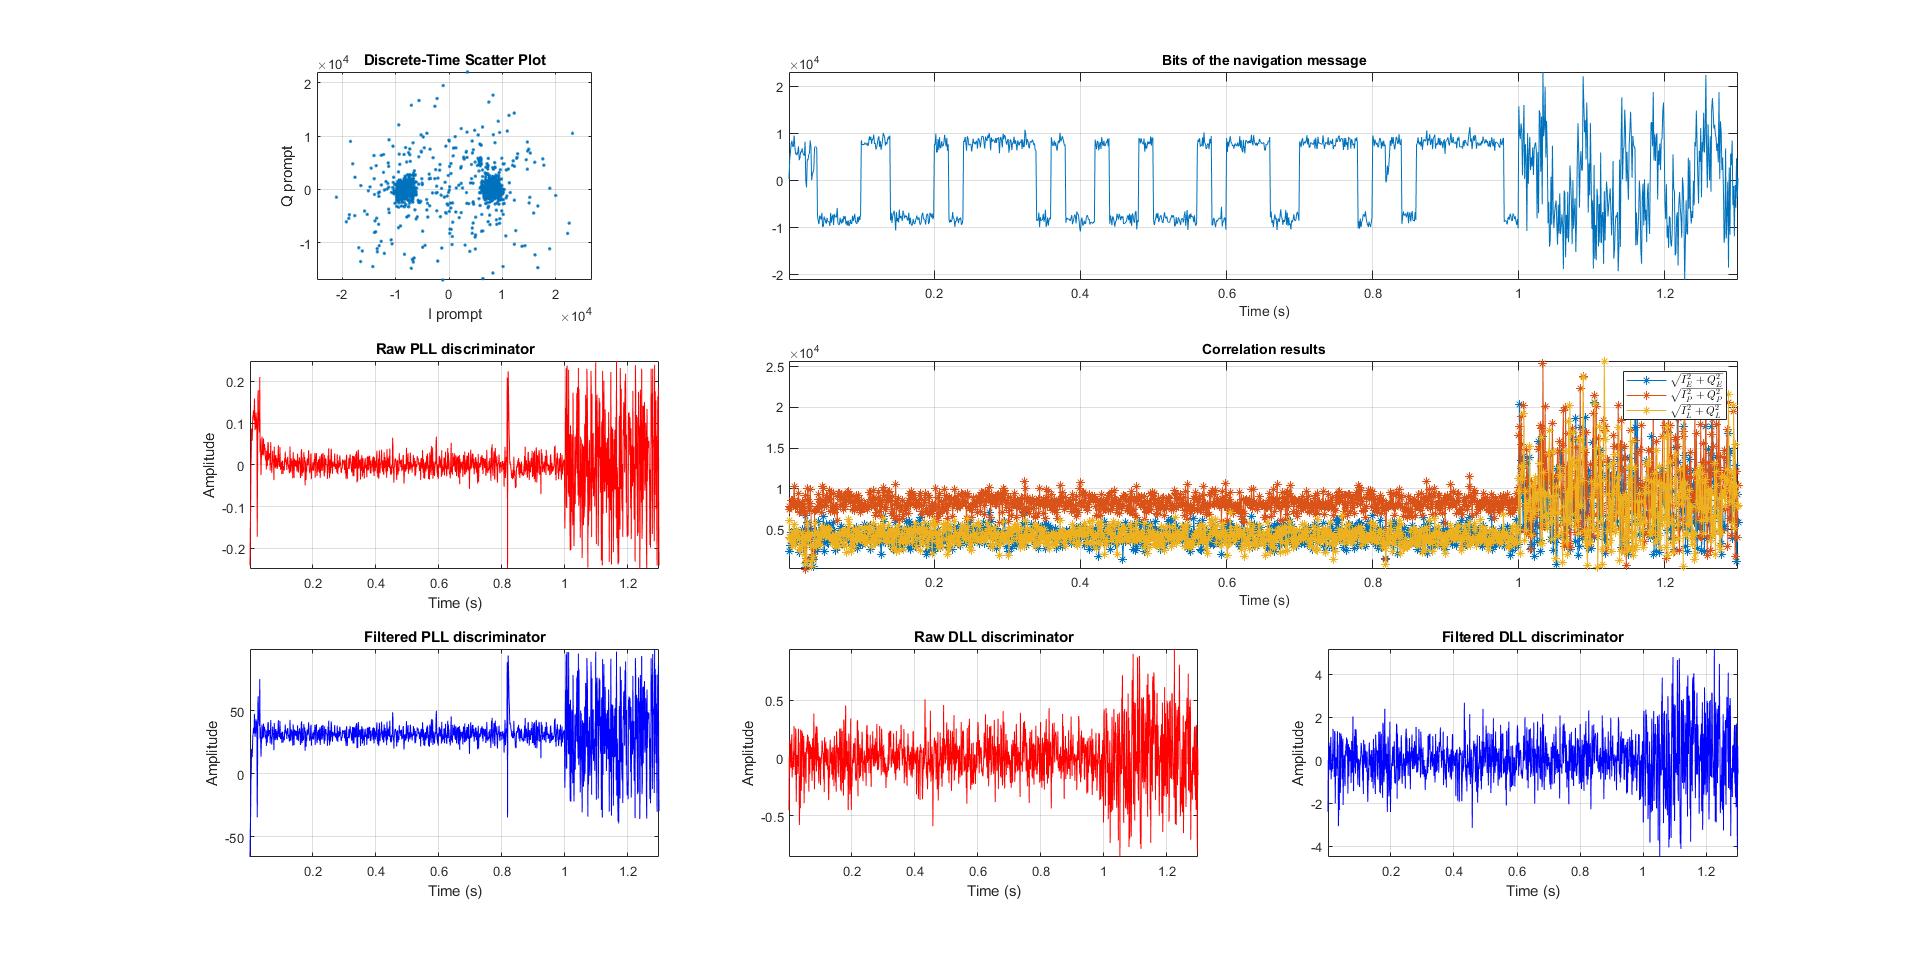
Now that the OP has clarified in the comments that this is an IF file for beginners I understand the issue. The point is to not be able to demodulate or recognize the individual chips of the GPS PRN sequence, in fact in typical application the received signal on the surface of the earth can typically be -20 dB SNR (pre-correlation) meaning it is 100x lower than the power of the noise! There is no way in such a signal to recognize any such sequence. However by multiplying with the received signal once translated completely to baseband with an aligned PRN code (the GPS C/A code for a particular satellite of interest) and then summing the result over a complete 1023 chip symbol is a great demonstration of processing gain and spread-spectrum demodulation (whose intent is to "pull signals out of the noise").
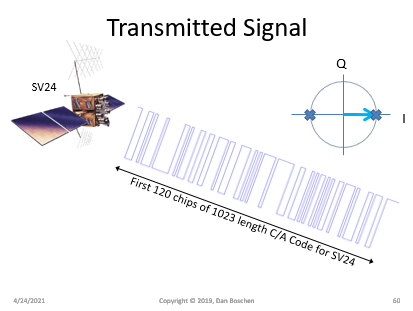
I detail this in the slides copied below, starting with the sequence as transmitted from a GPS satellite, representing the phase of the 1575.42 MHz carrier going back and forth between 0 and 180 degrees according to the sign of the C/A code being transmitted. The GPS C/A code, unique to each satellite, repeats every 1023 chips as a pseudo-random sequence as a PRN symbol at a 1.023 MHz rate. After every 20 symbols the PRN can be completely inversed (multiply by -1) according to the sign of the data bit being transmitted from the satellite, meaning the satellite will send 20 symbols to send a data bit "1" or the same 20 symbols all inverted to send a data bit "0" and thus transmits a 50 bps data rate:
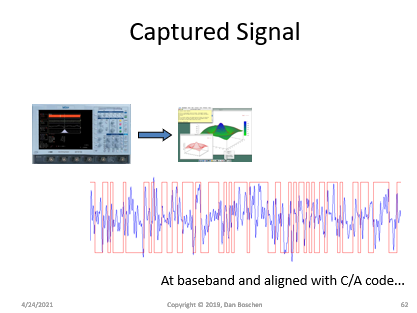
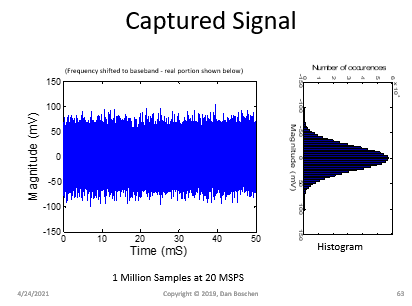
Below is live data that I captured (using a Lecroy O-scope as the A/D converter hence shown in the graphic), translated to baseband (all carrier frequency and phase offsets removed) and aligned using acquisition techniques to be exactly in phase with the transmitted code which is also shown in red. The received captured data in blue for all intents and purposes appears to us a additive white Gaussian noise, yet the code sequence is part of that waveform and using correlation we can extract the symbols being transmitted from the satellite (you may think that you can recognize in parts the original PRN, but trust me, you cannot possibly!):
A histogram of the actual captured waveform further confirms the appearance of Gaussian noise (and an FFT would confirm it is "white" over the sampling bandwidth used).
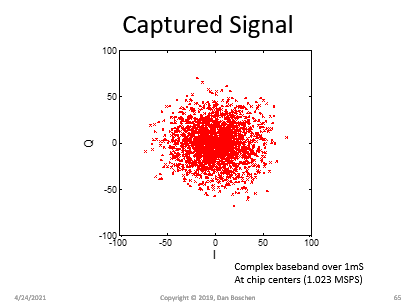
Here are the samples of the received signal on a complex IQ plot after being translated back to baseband and all carrier frequency and phase offsets removed. The red dots shown are all at the chip centers, which when transmitted at the satellite existing only at +1/-1 on the real axis. This plot shows the significance of the added noise to each of those samples, totally swamping out the actual chips that were transmitted.
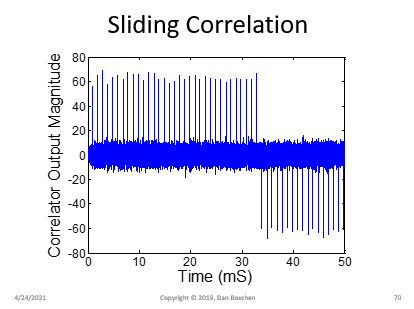
But after doing a sliding correlation with the same reference C/A code, we are able to clearly make out the boundaries of each of the 1023 chip symbols, and their overall phase associated with the 50 bps data transmitted by the satellite. Each sudden peak below occurs when the received waveform (after having been translated to baseband with all carrier frequency and phase removed) aligns in time with the reference C/A code, which is slid past the received waveform and after every offset a new correlation is computed (cross correlation function of the received sequence with the C/A code). We can see how there are at least 20 symbols in a row before the entire sequence is inverted (to change the data in the satellite between 1 and 0).
Hopefully this makes it all clearer that the intent of demodulation with GPS is nor to be able to extract what would appear to be a noise-free or even low noise C/A code itself, but operate at the symbol level after correlating with a received waveform where the C/A code is unrecognizably buried in the noise. The extracted C/A code symbols after correlation become the cleaner signal (at a much lower rate) with which to them perform typical receiver processing on. So the intent of tracking (and acquisition!) is to operate on post-correlation symbols in the latter low noise condition; the actual signals as received in practical application will never have the benefit of the high SNR as presented in the first half of the OP's waveform. Any solution that depends on such high SNR will therefore be flawed in its approach.
For further details of GPS and GPS acquisition in negative SNR condition, where some of these same figures are repeated, please see:
Auto-correlation of C/A code with 30dB noise
Phase transitions in GPS C/A signal
GPS Coarse Acquisition PRN Codes
GPS signal acquisition
GPS Receiver in Frequency Domain
Understanding time delay estimation for GPS?
Isn't Gardner's algorithm and Early-Late gate the same thing?

