Having pulled data from a MAX2769B in device state 2 (2-bit I only), I have found satellite signals by multiplying the I-only data by the respective PRN and taking the FFT of the data. Using this approach, I set the imaginary part to zero, and fill in the I*PRN data for the real part, thus real only data. If I configure the device to produce the quadrature data and attempt the same procedure, it's unclear what I should do. My first pass attempt at the approach did not produce a correlation peak at any frequency. If I scrap the Q data and fill it in with zeros, I get the same answer as before, and all is well. Should the quadrature data be used in an acquisition? Does it help? Presumably, it should be used in tracking, but then I would ask a follow-up question as to whether the quadrature data should be multiplied by the PRN sequence.
1 Answer
Yes both I and Q (in-phase and quadrature) data should be used in acquisition, even if the signals themselves are real (for example BPSK such as with GPS). The primary reason for this is an inevitable frequency offset due to Doppler from the relative motion of the SV and ground receiver, as well as small offsets in the master clocks themselves in both devices.
When using both I and Q to correlate to a real sequence with a frequency offset, the correlation peaks themselves will rotate at a rate that is equal to the frequency offset (either positive or negative rotation depending on if the actual carrier frequency is higher or lower). With this, we can measure the rate of rotation during acquisition and use that to correct for carrier offset (carrier recovery). The correlation peak will also reduce depending on the frequency offset and total time duration in the correlation as I further detail at this post.
If the frequency offset is greater than about $1/(2T)$ where $T$ is the total correlation time, then the estimated frequency offset would typically be stepped by that amount ($1/(2T)$) between correlations combined with a threshold detector for a correlation peak to indicate the frequency is close enough for fine acquisition which can then proceed using the I Q correlation peak values as explained further here, or alternatively multiple correlators can be run in parallel when resources allow and a fast acquisition is required (Essentially what I am doing here using FFT's for fast processing to simultaneously acquire in "one-shot" the carrier offset and code offset). Reducing $T$ is also an option, but that will also reduce overall signal to noise ratio.
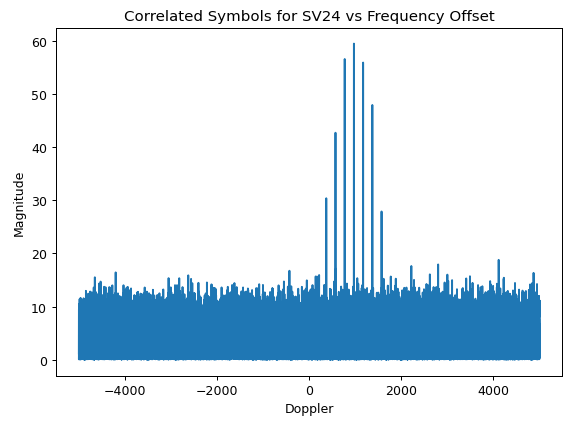
Another technique for acquisition is to down-convert to baseband using a slow frequency ramp (which is similar to step in frequency and correlate with very small and very frequent frequency steps). Below shows an example result with an actual GPS signal using a frequency ramp that sweeps from -5KHz to +5KHz over a time duration of 50 ms. (Since the GPS C/A code repeats every 1 ms, the frequency change over any correlation interval is 10KHz/50 = 200 Hz which is less than the maximum $1/(2T)=500$ Hz interval that I recommend above. We can see here at the 200 Hz / correlation interval ramp rate the correlation peak is sampled with approximately 7 visible peaks.
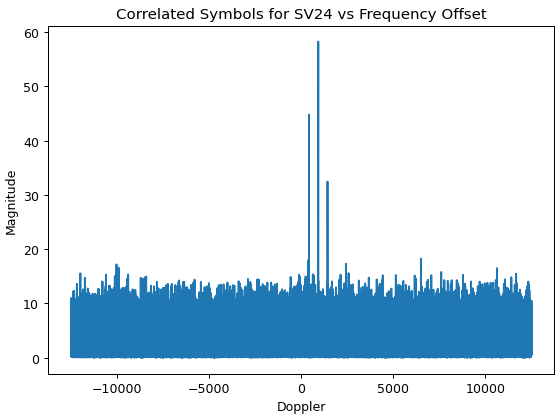
The number of samples that is visible would reduce as the ramp rate increases. At a 500 Hz rate, we would still be ensured 3 samples and therefore one close to the peak for a successful acquisition. I demonstrate this in the plot below with the same 50 ms data capture by extending the frequency ramp to go from -12.5KHz to +12.5KHz or 500 Hz per 1 ms correlation interval (of course what we would actually do is ramp over a shorter capture using the maximum possible frequency offset range we expect given Doppler and other frequency offset sources, for GPS +/-5KHz is a reasonable range for most applications):
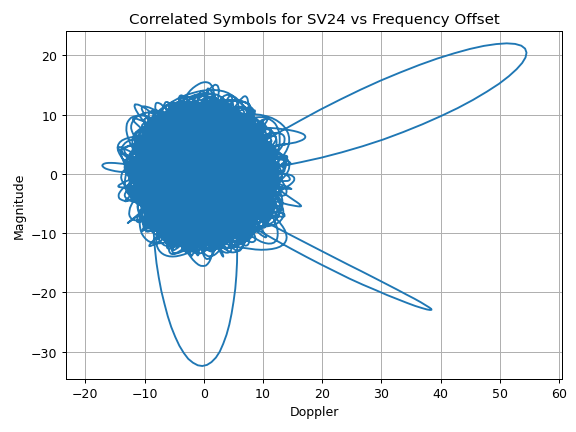
Specific to the OP's question, the above correlation results shown are the absolute magnitude using I and Q ($\sqrt{I^2 + Q^2}$). Below shows the complex correlation result for the same last plot above plotted on the complex I and Q plane. The maximum correlation in this result ended up around 20° but could have arbitrarily been anywhere which is why we need to use both I and Q at this point in the processing.


