0
$\begingroup$

I've a C# program that generates a GPS C/A code consisting of -1s and +1s.
Auto correlating the code with rotated versions of itself shows that the peak is 1023 and the next maximum value is 63 which agrees with what I expect.

Now my understanding is that in the GPS C/A signal the SNR is -30dB and the receiver is still able to detect a strong auto-correlation peak.

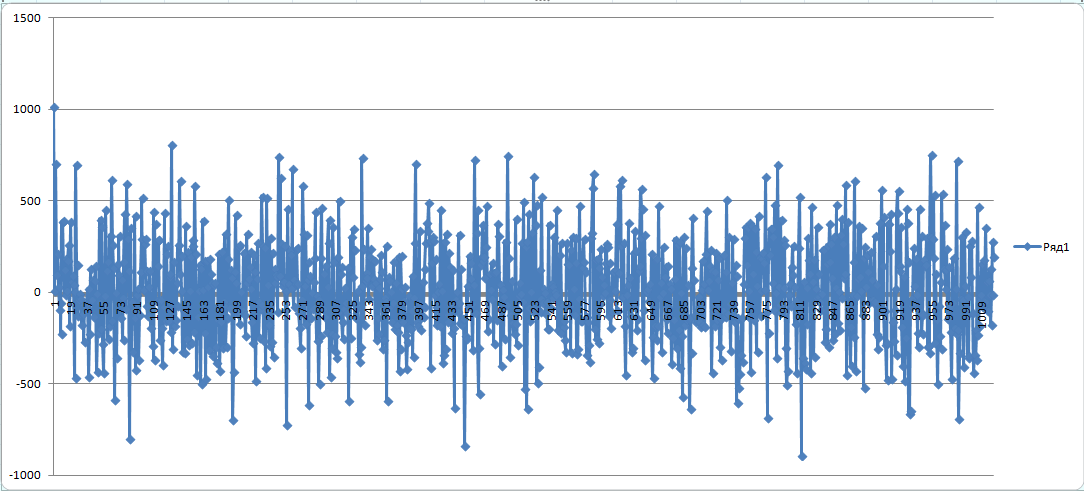
So I'm adding a random numbers between 0 and 30 (roughly 30dB) to one of the signals before the auto-correlation and now there's no strong peaks.

C/A code auto-correlation with 30dB pseudo-random noise

Where is the mistake in my reasoning?

using System;
using System.Collections.Generic;
using System.Linq;

namespace CrosssCorrelationTest
{
    class Program
    {
        static void Main(string[] args)
        {
            List<int> caCode = GenerateCaCode();
            var shiftedCaCode = new Queue<int>(caCode);
            AddNoise(caCode);

            double correlation = 0;
            double max1 = 0, max2 = 0;

            for(int i=1; i<1023; i++)
            {
                correlation = CrossCorrelate(caCode, shiftedCaCode.ToList());                
                if(correlation > max1)
                {
                    max2 = max1;
                    max1 = correlation;
                }
                else if(correlation > max2)
                {
                    max2 = correlation;
                }
                RotateBy1(shiftedCaCode);                
            }

            Console.WriteLine($"max1={max1}; max2={max2}");

            Console.ReadKey(true);
        }

        private static void AddNoise(List<int> caCode)
        {
            var r = new Random();
            for(int i=0; i<caCode.Count; i++)
            {
                caCode[i] += r.Next(30);
            }
        }

        private static double CrossCorrelate(List<int> caCode, List<int> caCode1)
        {
            int sum = 0;
            for(int i =0; i<caCode.Count; i++)
            {
                sum += caCode[i] * caCode1[i];
            }

            return sum;
        }

        private static void RotateBy1(Queue<int> shiftedCaCode)
        {
            int chip = shiftedCaCode.Dequeue();
            shiftedCaCode.Enqueue(chip);
        }

        private static List<int> GenerateCaCode()
        {
            int g1 = 1023; //10b'1111111111;
            int g2 = 1023; //10b'1111111111;

            var caCode = new List<int>();

            for (int i=1; i<=1023; i++)
            {
                int chip = (g1 ^ ((g2 >> 4) ^ (g2 >> 8))) & 1;

                caCode.Add(chip == 1 ? 1 : -1);

                g1 = (g1 >> 1) | (((g1 << 2) ^ (g1 << 9)) & 512);
                g2 = (g2 >> 1) | (((g2 << 9) ^ (g2 << 8) ^ (g2 << 7) ^ (g2 << 5) ^ (g2 << 2) ^ (g2 << 1)) & 512);
            }

            return caCode;
        }
    }
}
$\endgroup$
7
  • $\begingroup$ Are these gaussian random numbers or uniform random numbers? $\endgroup$
    – Ben
    Commented Dec 14, 2019 at 22:51
  • $\begingroup$ Uniform. Is this the reason? $\endgroup$
    – axk
    Commented Dec 14, 2019 at 22:51
  • $\begingroup$ Yeah I think, you're adding noise with DC bias. $\endgroup$
    – Ben
    Commented Dec 14, 2019 at 22:56
  • $\begingroup$ Remove the DC bias of your signal after adding the noise. $\endgroup$
    – Ben
    Commented Dec 14, 2019 at 22:56
  • 1
    $\begingroup$ The DC bias should have no impact if you are doing circular autocorrelation-- it will just offset the entire result accordingly. $\endgroup$ Commented Dec 15, 2019 at 1:39

1 Answer 1

2
$\begingroup$

GPS has a processing gain of 43 dB assuming you correlate over 20 consecutive symbols. (GPS sends 20 C/A code sequences for 1 data bit: Chip rate 1.023 MHz, data rate 50 bps). It looks like you are correlating over just one symbol which is at 1 KHz in which case the processing gain would only be $10Log_{10}(1023)= 30 \text{ dB}$.

However I don't think your noise is 30 dB stronger than your pre-correlation signal. The standard deviation for a uniform distribution with a range R is $\sigma = R/ \sqrt{12}$. If your range is 30, then the standard deviation would be 8.66. The DC offset does not effect standard deviation. The standard deviation for the C/A code that is +1/-1 is 1, so the predicted pre-correlation SNR would be 18.75 dB. In which case we should see peaks given an expected post-correlation SNR of 11.25 dB when correlating over 1 ms (1023 chips).

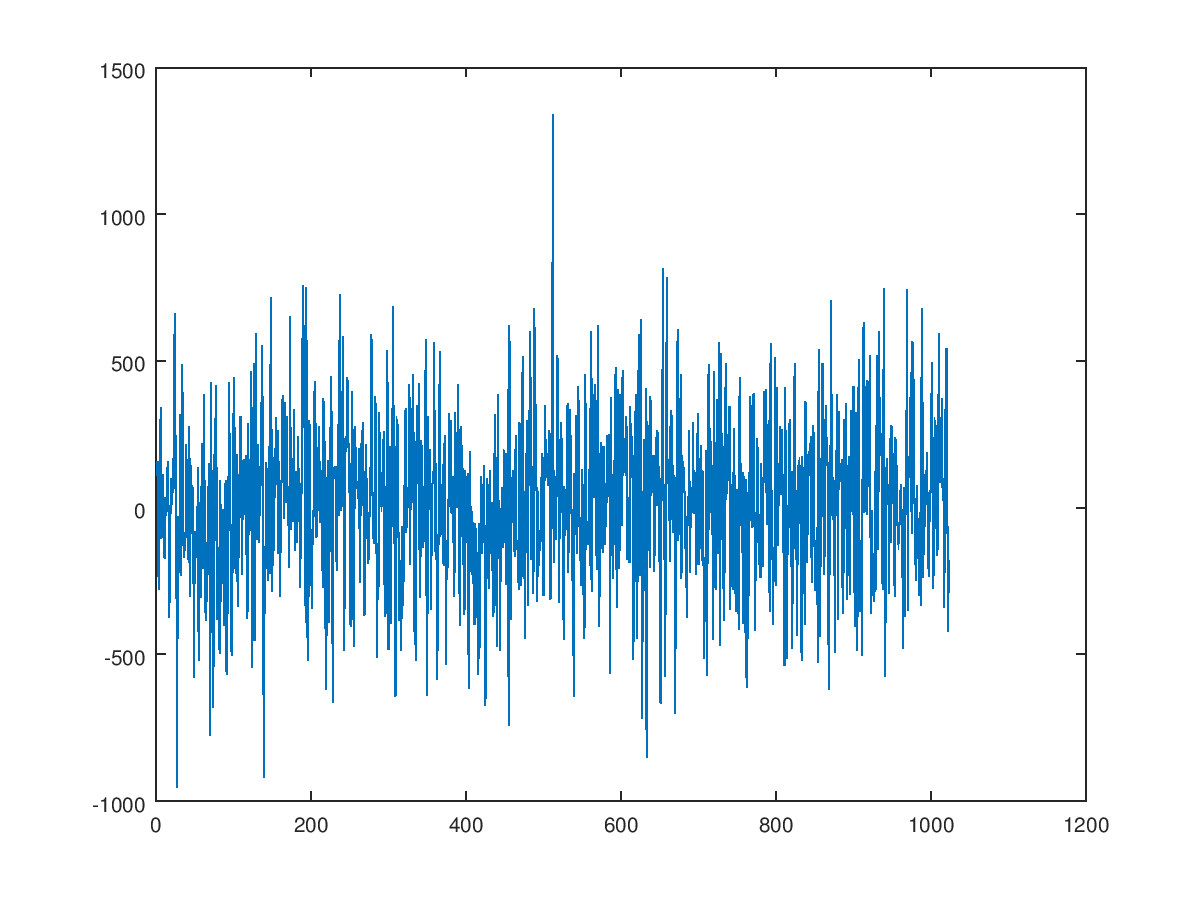
Here is the result I got from Matlab with the same test parameters (uniform noise 0 to 30, 1023 chips GPS C/A code +1/-1, correlated over one 1023 chip PRN sequence), where I also shifted 0 lag to be in the center of the plot.

Comparing my plot to yours I think your results are fine: I see a larger peak on the left side of your plot that is reasonably the expected correlation peak: Given the mean of the added noise is 15, the correlation and noise will be shifted up by 15, such that the mean of the peak would be 1023+15 = 1038. The peaks will vary by the post-correlation noise, which would have a standard deviation of $8.66\sqrt{1023}= 277$ and be now Gaussian distributed due to the law of large numbers. Therefore 68% of the peaks would be expected to be in the range of 1038 +/- 277.

Cross Correlation of SV6 with SV6 + Noise over 1 ms Correlation result for GPS

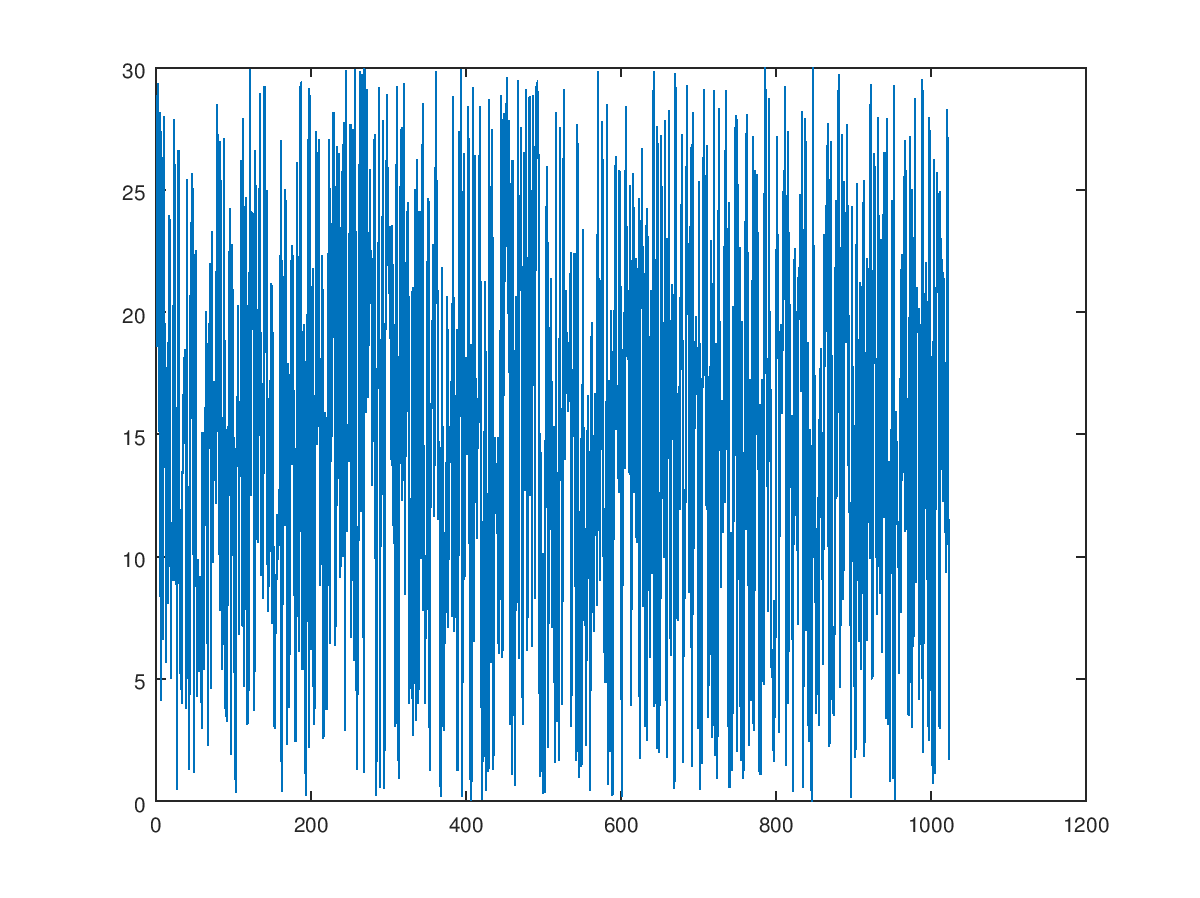
Added Noise Added Noise

To Ben's point in the comments, this is a LOT easier to prototype from Matlab/Octave or Python:

Matlab/Octave Code: (C/A Code generator cacode.m and further details on its implementation are available on this post GPS Coarse Acquisition PRN Codes)

s = cacode(6);  % C/A for SV6
s1 = s*2 -1;    % map to +1/-1
noise = rand(1,1023)*30;    % uniform noise
% circular cross correlation:
xcorr = ifft(fft(s1).*conj(fft(s1+noise)));
figure;
plot(real(xcorr));
$\endgroup$

Your Answer

By clicking “Post Your Answer”, you agree to our terms of service and acknowledge you have read our privacy policy.

Not the answer you're looking for? Browse other questions tagged or ask your own question.