0
$\begingroup$

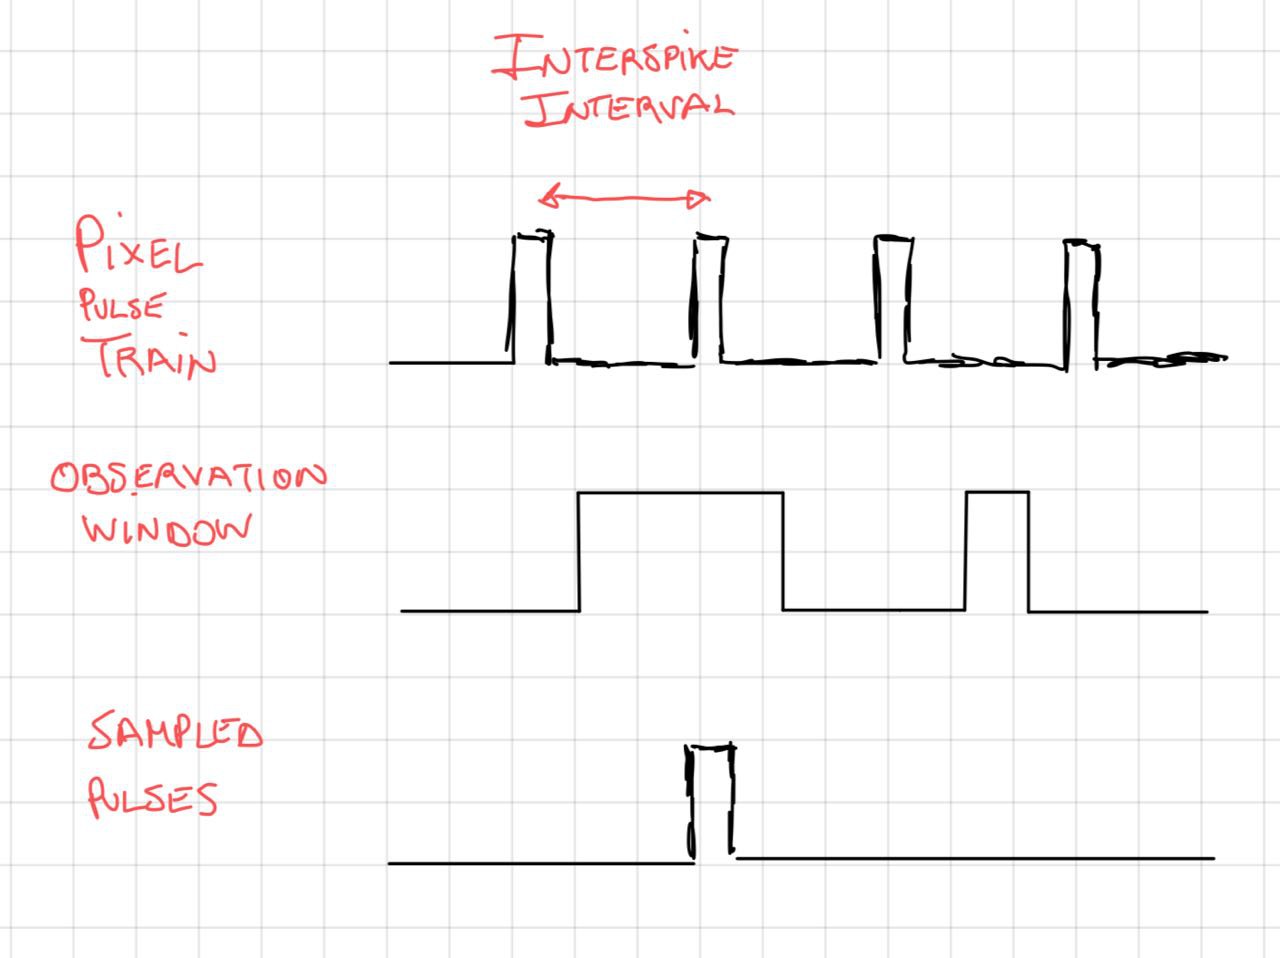
I have an issue regarding a sampling process of a pulse train in an image sensor based on events. Basically, these are a family of image sensors in which each pixel outputs a train of pulses, and the frequency of the pulses encodes the illumination of the pixel. The higher the frequency, the brighter the light hitting the pixel is.

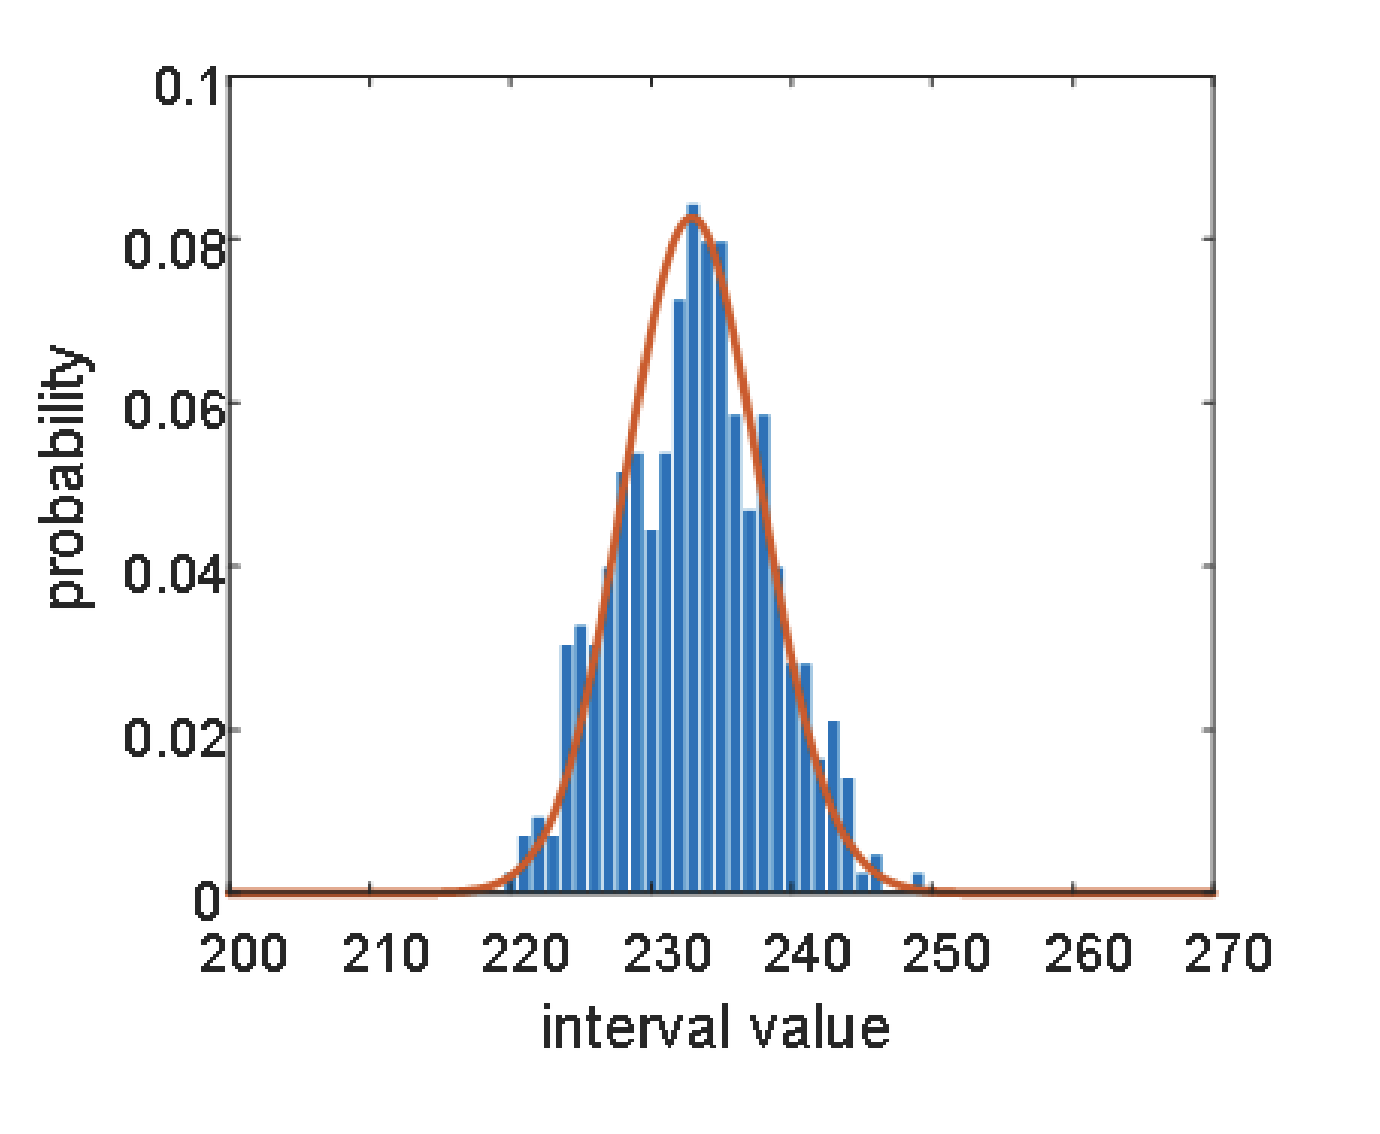
Now, the frequency of these spikes trains can be studied using a gamma distribution, as seen in the image. The interspike interval of the pulses in a pixel (that is, the time between pulses) is represented in blue, whereas orange is the gamma probability function Interspike Interval of the pulses in a pixel, that is, the time between pulses. In blue the interspike values, in orange the gamma probability function.
So, we introduced a switch to decouple these pulses from reading. And here is where I get disoriented. We aim to control the switch with a signal that acts as an observation window for the pulses. The window signal is a square wave, and we want to study different values for its period and width, and whether we can reconstruct the original information. The same window signal is shared by all pixels in the matrix.

enter image description here

Here is my question: Is this a recognizable sampling scheme, or did we just make something up? I can't find any information on sampling a train of pulses using an observation window. If we were to determine the period of the window signal using a probability distribution, wouldn't the combined statistics (the gamma distribution from the pixel and the one from the observation window) be something like the product of both, or even the convolution?

Thanks in advance!

EDIT: to be more clear, what I want to know is what type of mathematical and statistical analysis can I use to determine the probability of finding a pulse inside an observation time window for a pixel.

$\endgroup$
12
  • $\begingroup$ Hm, are these pulses always the same duration? Because what you sound would usually be called PDM, pulse density modulation. $\endgroup$ Commented Aug 9, 2023 at 15:19
  • $\begingroup$ Also, I think your window in your example is too short, and your example is the perfect illustration of why: you get 100% quantization error if your observation window is shorter than the longest relevant interspike interval. $\endgroup$ Commented Aug 9, 2023 at 15:20
  • $\begingroup$ Hi! Thanks for your comment. The pixel pulses are always the same duration, yes. Actually, what the pixels implement is a pulse frequency modulation of its photogenerated current. But my struggle is with the window. As you mentioned, the example shows that I will be loosing pulses. But if I define the window correctly, then the probability of finding at least 1 pulse in a pixel will be higher in pixels with higher frequency. That is the mathematical analysis I am interesed in. $\endgroup$
    – Spalo
    Commented Aug 9, 2023 at 15:30
  • $\begingroup$ So, OK, regarding "I can't find any information on sampling a train of pulses using an observation window", really look for "Pulse Density Modulation" (PDM), this is a super common format, and there's various ways of sampling it, including yours, but yours is kind of the worst approach, as you see. $\endgroup$ Commented Aug 9, 2023 at 15:33
  • $\begingroup$ "That is the mathematical analysis I am interesed in." OK, that seems to be a different question than you were asking above, right? $\endgroup$ Commented Aug 9, 2023 at 15:34

1 Answer 1

0
$\begingroup$

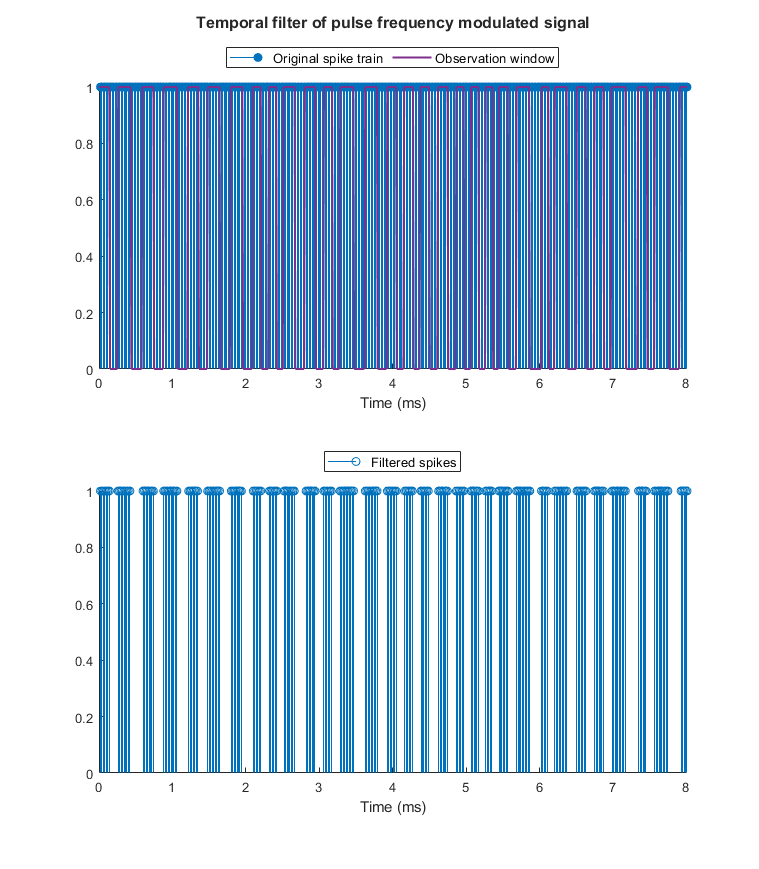
Here is a simulation in Matlab, in which I generate a train of pulses with a period following a normal distribution. The observation time window has a high pulse time (th) determined by a Uniform distribution, and the low pulse time is a multiple of th given by a configurable Duty Cycle. Below is the filtered, or modulated, signal.

enter image description here

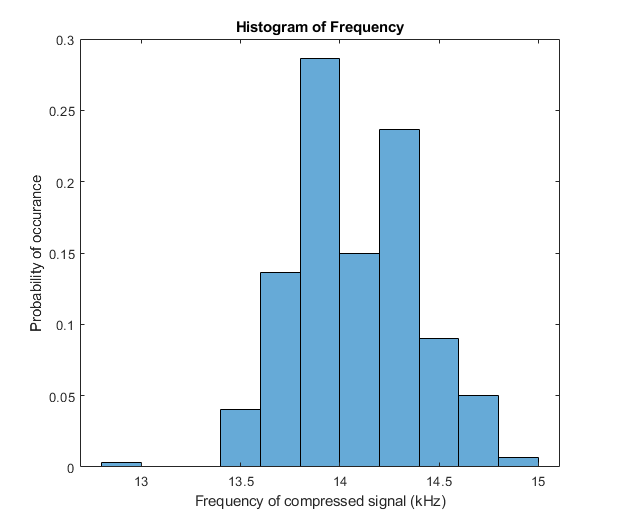
By calculating the frequency of the modulated signal as the number of pulses in the total time period, and simulating 300 times (each time generating a new time window, as there is randomness in the Uniform distribution) I get this frequency histogram, which looks like a normal distribution.

enter image description here

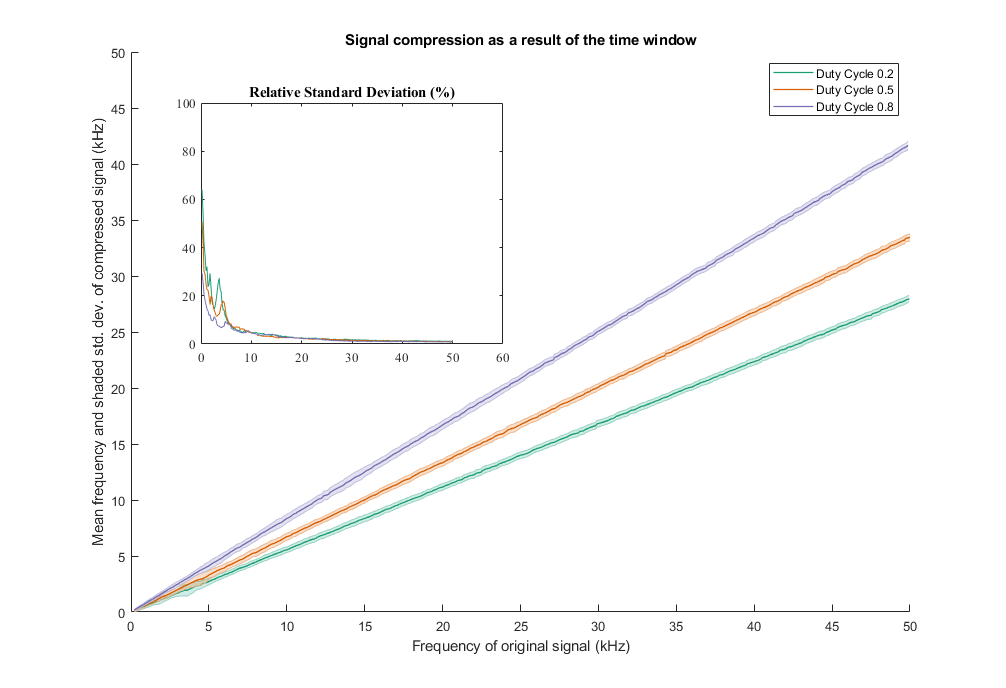
Then, the script simulates the entire range of frequencies of the pixels (from 50 kHz to 200 Hz), 300 times per frequency, and I get this plot for different duty cycles. The shaded region is 3sigma. I get the same linear behavior but with fewer pulses. There are some trade-offs, but I think the results may work in laboratory, although I need to check if the image can still be represented with 8 bits.

enter image description here

I will read more about compressed sensing, I am not sure yet if this particular solution can be inserted in that field.

$\endgroup$

Your Answer

By clicking “Post Your Answer”, you agree to our terms of service and acknowledge you have read our privacy policy.

Not the answer you're looking for? Browse other questions tagged or ask your own question.