Bumped by Community user
added 206 characters in body
Source Link

I have an issue regarding a sampling process of a pulse train in an image sensor based on events. Basically, these are a family of image sensors in which each pixel outputs a train of pulses, and the frequency of the pulses encodes the illumination of the pixel. The higher the frequency, the brighter the light hitting the pixel is.

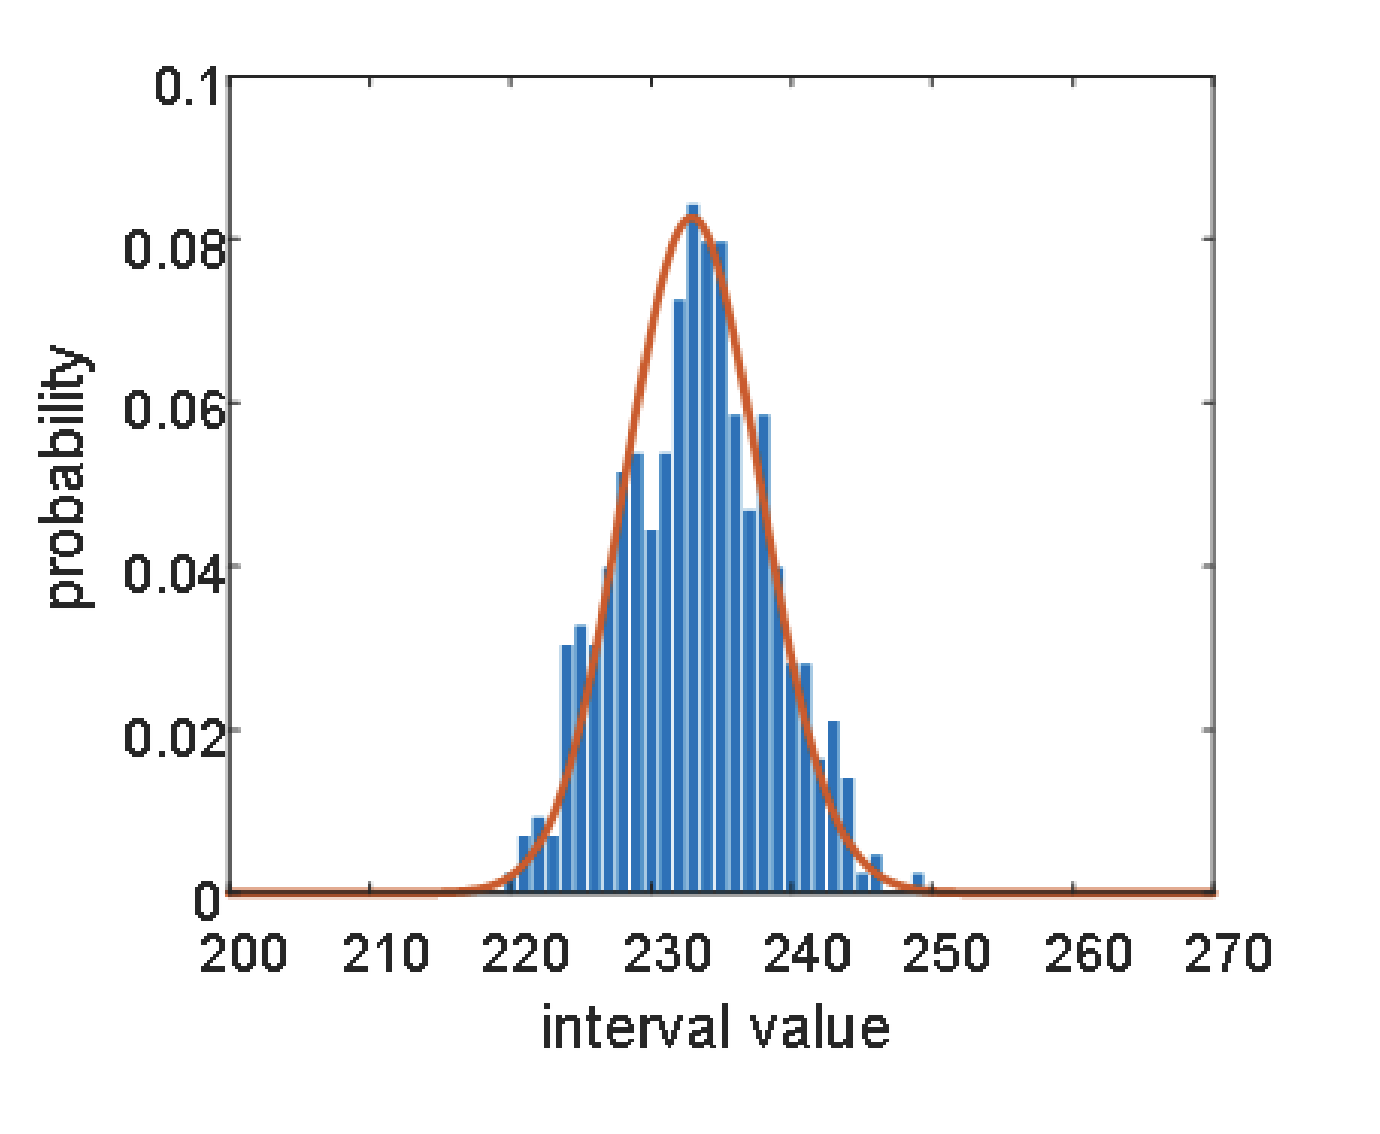
Now, the frequency of these spikes trains can be studied using a gamma distribution, as seen in the image. The interspike interval of the pulses in a pixel (that is, the time between pulses) is represented in blue, whereas orange is the gamma probability function Interspike Interval of the pulses in a pixel, that is, the time between pulses. In blue the interspike values, in orange the gamma probability function.
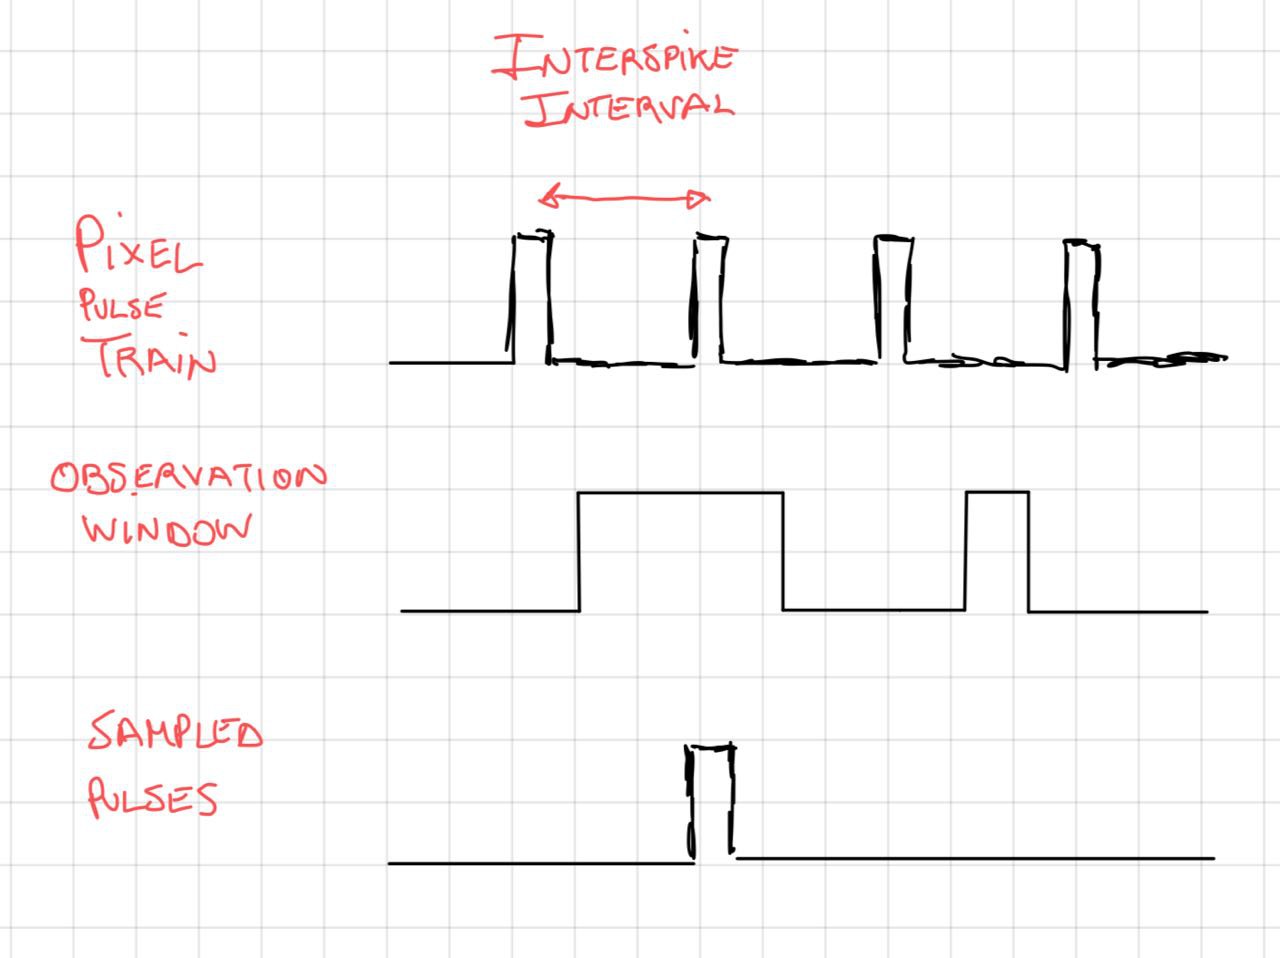
So, we introduced a switch to decouple these pulses from reading. And here is where I get disoriented. We aim to control the switch with a signal that acts as an observation window for the pulses. The window signal is a square wave, and we want to study different values for its period and width, and whether we can reconstruct the original information. The same window signal is shared by all pixels in the matrix.

enter image description here

Here is my question: Is this a recognizable sampling scheme, or did we just make something up? I can't find any information on sampling a train of pulses using an observation window. If we were to determine the period of the window signal using a probability distribution, wouldn't the combined statistics (the gamma distribution from the pixel and the one from the observation window) be something like the product of both, or even the convolution?

Thanks in advance!

EDIT: to be more clear, what I want to know is what type of mathematical and statistical analysis can I use to determine the probability of finding a pulse inside an observation time window for a pixel.

I have an issue regarding a sampling process of a pulse train in an image sensor based on events. Basically, these are a family of image sensors in which each pixel outputs a train of pulses, and the frequency of the pulses encodes the illumination of the pixel. The higher the frequency, the brighter the light hitting the pixel is.

Now, the frequency of these spikes trains can be studied using a gamma distribution, as seen in the image. The interspike interval of the pulses in a pixel (that is, the time between pulses) is represented in blue, whereas orange is the gamma probability function Interspike Interval of the pulses in a pixel, that is, the time between pulses. In blue the interspike values, in orange the gamma probability function.

So, we introduced a switch to decouple these pulses from reading. And here is where I get disoriented. We aim to control the switch with a signal that acts as an observation window for the pulses. The window signal is a square wave, and we want to study different values for its period and width, and whether we can reconstruct the original information. The same window signal is shared by all pixels in the matrix.

enter image description here

Here is my question: Is this a recognizable sampling scheme, or did we just make something up? I can't find any information on sampling a train of pulses using an observation window. If we were to determine the period of the window signal using a probability distribution, wouldn't the combined statistics (the gamma distribution from the pixel and the one from the observation window) be something like the product of both, or even the convolution?

Thanks in advance!

EDIT: to be more clear, what I want to know is what type of mathematical and statistical analysis can I use to determine the probability of finding a pulse inside an observation time window for a pixel.

added 22 characters in body
Source Link

I have an issue regarding a sampling process of a pulse train in an image sensor based on events. Basically, these are a family of image sensors in which each pixel outputs a train of pulses, and the frequency of the pulses encodes the illumination of the pixel. The higher the frequency, the brighter the light hitting the pixel is.

Now, the frequency of these spikes trains can be studied using a gamma distribution, as seen in the image. The interspike interval of the pulses in a pixel (that is, the time between pulses) is represented in blue, whereas orange is the gamma probability function Interspike Interval of the pulses in a pixel, that is, the time between pulses. In blue the interspike values, in orange the gamma probability function.

So, we introduced a switch to decouple these pulses from reading. And here is where I get disoriented. We aim to control the switch with a signal that acts as an observation window for the pulses. The window signal is a square wave, and we want to study different values for its period and width, and whether we can reconstruct the original information. The same window signal is shared by all pixels in the matrix.

enter image description here

Here is my question: Is this a recognizable sampling scheme, or did we just make something up? I can't find any information on sampling a train of pulses using an observation window. If we were to determine the period of the window signal using a probability distribution, wouldn't the combined statistics (the gamma distribution from the pixel and the one from the observation window) be something like the product of both, or even the convolution?

Thanks in advance!

I have an issue regarding a sampling process of a pulse train in an image sensor based on events. Basically, these are a family of image sensors in which each pixel outputs a train of pulses, and the frequency of the pulses encodes the illumination of the pixel. The higher the frequency, the brighter the light hitting the pixel is.

Now, the frequency of these spikes trains can be studied using a gamma distribution, as seen in the image. The interspike interval of the pulses in a pixel (that is, the time between pulses) is represented in blue, whereas orange is the gamma probability function Interspike Interval of the pulses in a pixel, that is, the time between pulses. In blue the interspike values, in orange the gamma probability function.

So, we introduced a switch to decouple these pulses from reading. And here is where I get disoriented. We aim to control the switch with a signal that acts as an observation window for the pulses. The window signal is a square wave, and we want to study different values for its period and width, and whether we can reconstruct the original information. The same window signal is shared by all pixels in the matrix.

enter image description here

Here is my question: Is this a recognizable sampling scheme, or did we just make something up? I can't find any information on sampling a train of pulses using an observation window. If we were to determine the period of the window signal using a probability distribution, wouldn't the combined statistics (the gamma distribution from the pixel and the one from the observation window) be something like the product of both, or even the convolution?

Thanks in advance!

Source Link

Sampling a pulse train with a controllable square wave

I have an issue regarding a sampling process of a pulse train in an image sensor based on events. Basically, these are a family of image sensors in which each pixel outputs a train of pulses, and the frequency of the pulses encodes the illumination of the pixel. The higher the frequency, the brighter the light hitting the pixel is.

Now, the frequency of these spikes trains can be studied using a gamma distribution, as seen in the image. The interspike interval of the pulses in a pixel (that is, the time between pulses) is represented in blue, whereas orange is the gamma probability function Interspike Interval of the pulses in a pixel, that is, the time between pulses. In blue the interspike values, in orange the gamma probability function.

So, we introduced a switch to decouple these pulses from reading. And here is where I get disoriented. We aim to control the switch with a signal that acts as an observation window for the pulses. The window signal is a square wave, and we want to study different values for its period and width, and whether we can reconstruct the original information. The same window signal is shared by all pixels in the matrix.

enter image description here

Here is my question: Is this a recognizable sampling scheme, or did we just make something up? I can't find any information on sampling a train of pulses using an observation window. If we were to determine the period of the window signal using a probability distribution, wouldn't the combined statistics (the gamma distribution from the pixel and the one from the observation window) be something like the product of both, or even the convolution?