0
$\begingroup$

Pulse amplitude modulation in general is often explained using plots like this one from wikipedia: enter image description here
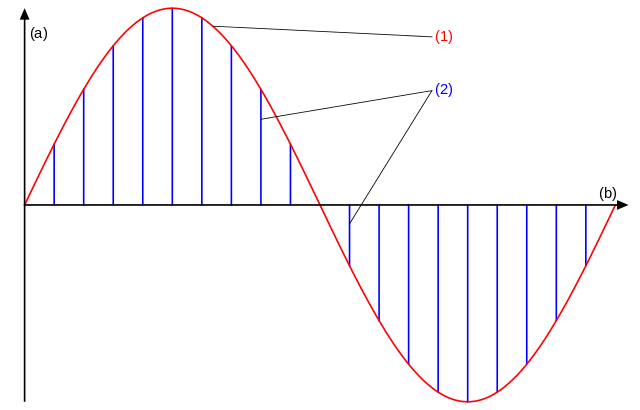
There is a sinusoid analog signal (red) to be "imprinted" on a train of pulses. The result is a train of pulses with varying amplitudes. (the blue signal)

When looking at the waveform and eye-diagram of a PAM-4 signal we see something like this:enter image description here What is the relation between this and the concept explained on wikipedia?

In the first case (the wikipedia plot), we have an anolog information that is put onto a pulse train.

In the second case case we have a quartenary discrete signal that is encoded in an analog signal that does not seem to have any pulses. We can see in the eye diagram, that the signal does not abruptly reach an amplitude and return to some "baseline" like a pulse, instead it's almost just a direct line between different amplitudes levels. Is the waveform that actually goes over the wire the equivalence of the red signal of wikipedia's plot rather than the blue? Does the pulse train enter the stage when the signal is decoded? The only connection I can see is that the amplitude of the signal represents the information. Otherwise how do these concepts relate at all?

$\endgroup$

1 Answer 1

1
$\begingroup$

There are two different concepts at play here sharing the name PAM, and the Wikipedia article is not helpful at all to disentangle them.

The first meaning of PAM is related to the problem of converting a continuous-time (CT) signal to a discrete-time (DT) signal. Many different techniques have been used over the past 70 or so years. Examples are pulse-width modulation (PWM), pulse-position modulation (PPM), delta-sigma, etcetera. In this context, PAM converts a CT signal to DT by (a) sampling, and (b) transmitting a narrow pulse with amplitude proportional to the sampled value. The pulses are spaced according to the sampling period. This corresponds to the first plot in your question.

These techniques are mostly of historical interest (variations of delta-sigma and PWM are still used in some applications). Most current communications systems use pulse-code modulation (PCM), which is similar to PAM except that the sampled values are quantized and then converted to e.g. a binary or quaternary number.

This takes us to the second meaning of PAM, which corresponds to the plots at the bottom of your question. There are many related questions/answers on this site, but here's a quick explanation. An analog signal is sampled; then, the samples are quantized and converted to numbers in base-4 (since your question is about 4-PAM.) This resuls in a sequence of (real) numbers $a_k$.

Now, choose a signaling rate $R = 1/T$ and a convenient pulse shape $p(t)$, say a square-root raised cosine. To create the 4-PAM signal, follow these steps:

  1. Form a train of time-shifted pulses: $\sum_k p(t-kT)$
  2. Scale each pulse by $a_k$: $\sum_k a_k p(t-kT)$

This signal corresponds to the waveform you show in your question, as well as its eye diagram.

Naturally, this also works to transmit digital data, not just analog waveforms: the sequence $a_k$ is built by taking two data bits at a time and converting them to a single base-4 digit.

$\endgroup$
5
  • $\begingroup$ If the p(t) function was a train of (impossible) "ideal" impulses, i.e. zero every except in t=0, it would look like the first concept, right? So the fact that instead of pulses we see wider levels is because the actual pulse function used is "wide" in relation to T, no? If T was sufficiently long, would we see the signal "return to zero" inbetween the information-carrying pulses? $\endgroup$
    – JMC
    Commented Nov 2, 2023 at 0:05
  • $\begingroup$ "If the p(t) function was a train of ideal impulses, i.e. zero every except in t=0, it would look like the first concept, right?" No, it wouldn't, because in 4-PAM the sample values have been quantized and encoded. For example, assume a sample is 3.8556783, it is quantized to 3.86 and encoded to binary 100101. Then, the pulse amplitudes would be (say) {0.5, -0.5, -0.5, 0.5, -0.5, 0.5}. In the original, older sense of PAM, the pulses have the exact same amplitude as the sample; that is, you'd transmit one single pulse with amplitude 3.8556783. $\endgroup$
    – MBaz
    Commented Nov 2, 2023 at 13:28
  • $\begingroup$ Thanks, that makes sense. In my comparison to the first sense of PAM I was only just thinking of the width of the pulses rather than the amplitudes. So my last question still stands: In the PAM-4 waveform and eye diagram it looks like the pulses are so wide that they completely blend into eachother, which looks almost like there never were any pulses in the first place, but instead as if the voltage instead just went immediately from one level to the other like a smoother "staircase" function where the heights of the stairs are the 4 levels of the encoding. Why is the p(t) function so wide? $\endgroup$
    – JMC
    Commented Nov 2, 2023 at 20:56
  • $\begingroup$ Sometimes PAM-4 is even depicted like a "stairs" function as in this figure: tek.com/-/media/sites/default/files/media/image/… The only way I can reconcile this with your mathematical description as a sum of pulses is if the pulses have the shape of the box-filter/box-distribution and are exactly as wide as the interval between them. Why is this then still analyzed as a sum of "pulses"? $\endgroup$
    – JMC
    Commented Nov 2, 2023 at 21:03
  • $\begingroup$ Well, strictly speaking it is a sum of pulses, if you define $p(t)$ as a rectangular pulse, right? You can choose any shape for $p(t)$, but some are better than others. $\endgroup$
    – MBaz
    Commented Nov 2, 2023 at 21:21

Your Answer

By clicking “Post Your Answer”, you agree to our terms of service and acknowledge you have read our privacy policy.

Not the answer you're looking for? Browse other questions tagged or ask your own question.