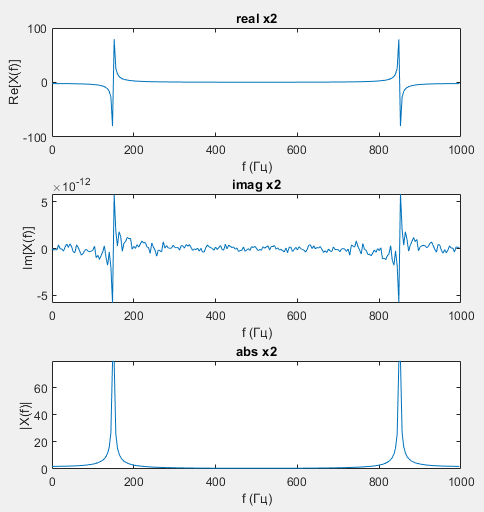
A little story. At the university, I did laboratory work on expanding functions into the Fourier series. I have this drawing. My teacher told me he is faithful. But he asked me this question: "Why does a harmonic signal with a frequency of $150 ~ Hz$ have such a complex spectrum?"
I decided that it made a difference for the two peaks at $150 ~ Hz$ and $850 ~ Hz$.
Answered as follows:
$$ \sin \left( \phi \right) = \frac{e^{i \phi} - e^{-i \phi}}{2 i} \tag{1} \label{1} $$
$$ \eqref{1} \rightarrow A \sin \left( 2 \pi f t \right) = \frac{A}{2 i} \left( e^{2 \pi i f t} - e^{2 \pi i f t} \right) \tag{2} \label{2} $$
For a sine wave signal, the Fourier transform has two peaks: one at the positive frequency and one at the negative frequency.
Teacher's answer:
You answered the wrong question I asked. Euler's formula is useful when you want to show the spectrum of sine waves mathematically. In order for the symmetry of any signal to be visible, it is necessary to display it over the full period of influence, either from $-\frac{F_{s}}{2}$ to $\frac{F_{s}}{2}$, or from $0$ to $F_{s}$. The symmetry of what is happening is visible. The question is why the spectrum of the signal related to one harmonic of $150 ~ Hz$ has a complex appearance at the top of the figure."
I don’t really understand how to answer this question and I’ve been trying to submit my work for $3$ weeks now. Maybe someone can tell me.
$T = 0.25 с$, $d t = 0.001$, $f_{1} = 150 ~ Hz$, $x = A \sin \left( 2 \pi f t \right)$
Code
T = 0.25;
dt = 0.001;

f1 = 150;

Fs = 1/dt;
N = fix(T/dt);
t = 0:dt:(N-1)*dt;
f = (0:N-1) * Fs / N;

x1 = sin(2*pi*f1*t);

X1 = fft(x1);

rest_x1 = ifft(X1);

subplot(3,2,[1,2]), plot(t, x1), title('Signal | Time domain');
xlabel('t (sec) '), ylabel('x1(t)');

figure;

subplot(3,2,[1,2]), plot(f, real(X1)), title('real x1');
xlabel('f (Hz)'), ylabel('Re[X(f)]');

subplot(3,2,[3,4]), plot(f, imag(X1)), title('imag x1');
xlabel('f (Hz)'), ylabel('Im[X(f)]');

subplot(3,2,[5,6]); plot(f, abs(X1)), title('abs x1');
xlabel('f (Hz)'), ylabel('|X(f)|');


