2
$\begingroup$

First, I apologize for the repost, I got really confused how Stack Exchange works. I tried my best to improve the question!

Anyhow - I'm fairly new to the world of DSP, and I'm struggling with finding a way to plot the frequency spectrum of a discrete signal I calculated, described by

$$x(k) = 4 \left(\frac{\sin(4\pi k/6)}{4\pi k/6}\right)^2$$

with $x(0)=2$

using Matlab.

I have so far tried 4 different solutions, only one of which looks plausible, but I'd like to be sure. I know it's probably solved using the fft function, but I can't quite put it together.

Could someone help me figure this out? It'd be greatly appreciated!

Edit: As kindly suggested - and I really should have thought of it -- this is the Matlab code I'm currently working with:

k = -12:12;

x_k = 4 * (sin(4 * pi * k / 6) ./ (4 * pi * k / 6)).^2;
x_k(k == 0) = 2; 

X_f = fftshift(fft(x_k));

f = linspace(-0.5, 0.5, length(k));  

figure;
stem(f, abs(X_f), 'filled');
title('Frequency Spectrum of the Discrete Signal x(k)');
xlabel('Frequency');
ylabel('Magnitude');
grid on;

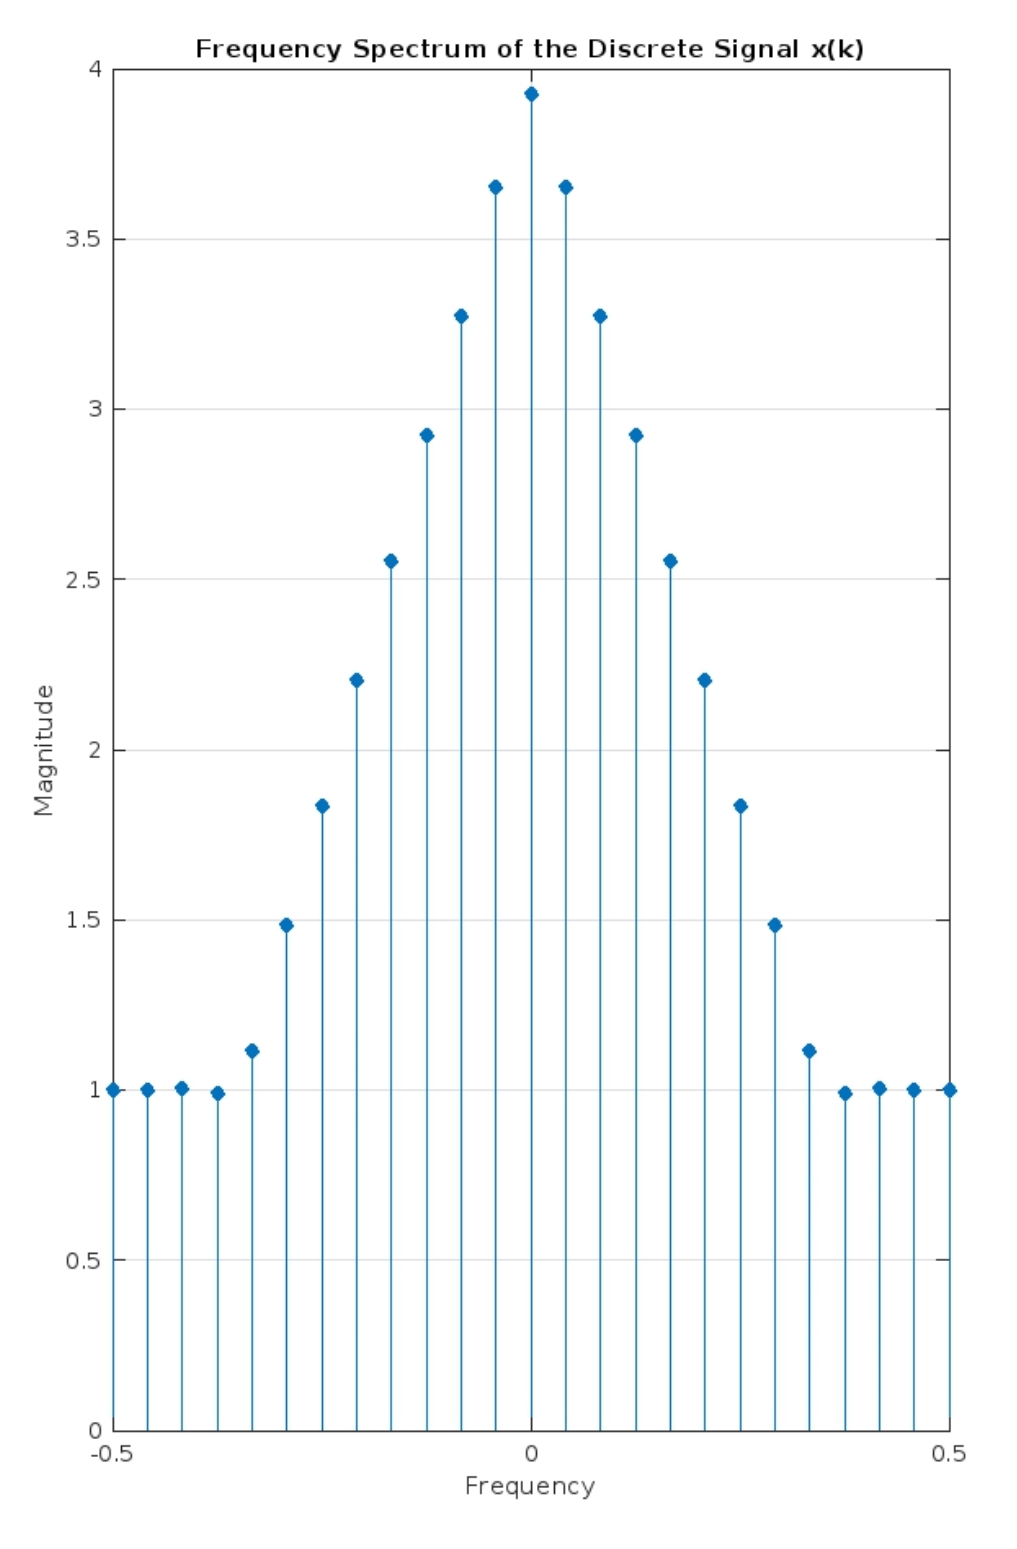
And this is a picture of the resulting spectrum:

Spectrum

$\endgroup$
2
  • 2
    $\begingroup$ Hi! As I had commented in your now-deleted previous question, please show what you’ve tried (your “plausible” solution). Add your Matlab code at least, and even better also a picture of the resulting spectrum. To do so, use “edit” at the bottom of your question $\endgroup$
    – Jdip
    Commented Jul 12 at 5:00
  • 1
    $\begingroup$ I think you code does what you want it to do. If you recognize the mathematical equation, you might recognize it is actually a sinc function. So, it would be a fun exercise by playing with different parameters to see how the plot/shape of the wave changes with changing different parameters. $\endgroup$ Commented Jul 12 at 9:16

2 Answers 2

0
$\begingroup$

Use the code below, here Ts = 1/Fs, where Ts is the sampling time of your signal and L is the number of points in your signal

Y = fft(X);
    P2 = abs(Y/L);
        P1 = P2(1:L/2+1);
        P1(2:end-1) = 2*P1(2:end-1);
        
        f = Fs/L*(0:(L/2));
        plot(f,P1,"LineWidth",3) 
        title("Single-Sided Amplitude Spectrum of X(t)")
        xlabel("f (Hz)")
        ylabel("|P1(f)|")

Source: https://in.mathworks.com/help/matlab/ref/fft.html

$\endgroup$
0
0
$\begingroup$

1.-

You have chosen an input caridnal sin , the famous sinc function with 1st null at f0=2/3 Hz.

Because sin(4*pi*k/6) = sinc (4/6)

2.-

It's always useful to define the time step dt and the sampling frequency Fs .

Both come handy when going from 2-side spectrum produced by fft to 1-side spectrum, as well as to calculate all the frequency points.

So here we go

dt=.01;
Fs=1/dt;
t = [-12:dt:12];

f0=1/3;

% x = 2*(sin(2*pi*f0*t)./(2*pi*f0*t)).^2;
x = 2*(sinc(f0*t)).^2;

% x(end)=[];   % even amount of time samples
L=numel(x);

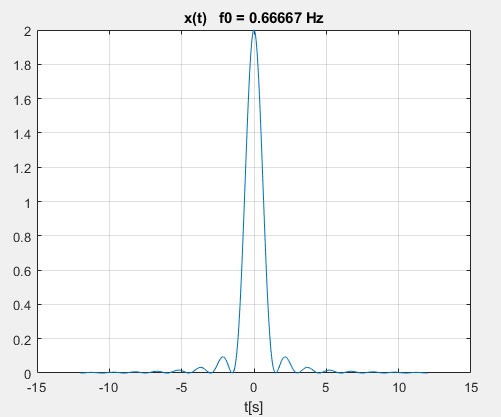
figure(1);     % time domain
ax1=gca
plot(ax1,x)
title(ax1,['x(t)   f0 = ' num2str(f0) ' Hz'])
xlabel(ax1,'t[s]');

enter image description here

X=fft(x,numel(x));
absX=abs(X);

% 1-side 
P2=abs(X/L);
P1=P2(1:L/2+1);
P1(2:end-1) = 2*P1(2:end-1);

% calculating frequencies
f = Fs*(0:(L/2))/L;

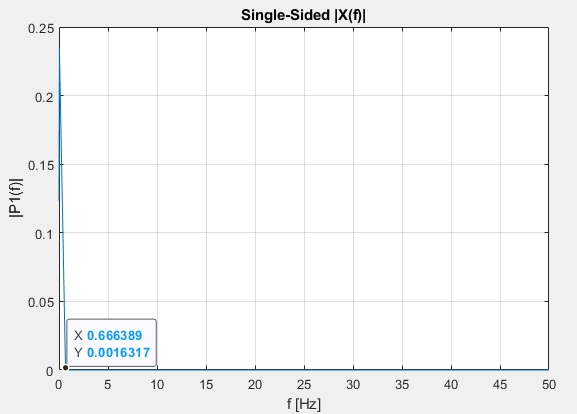
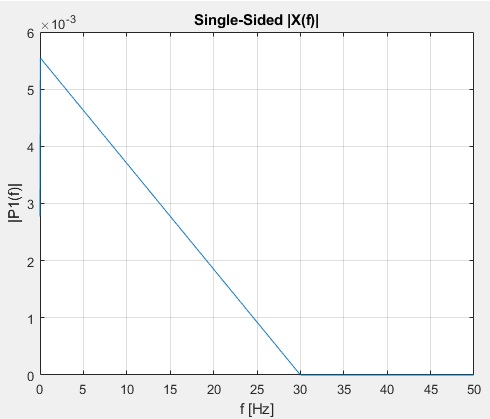
figure(2)     % frequency domain
ax2=gca
plot(ax2,f,P1) 
title(ax2,'Single-Sided |X(f)|')
xlabel(ax2,'f [Hz]')
ylabel(ax2,'|P1(f)|')
grid(ax2,'on');

enter image description here

3.-

You may have already obtained the correct spectrum but it may have been stuck to the Y axis.

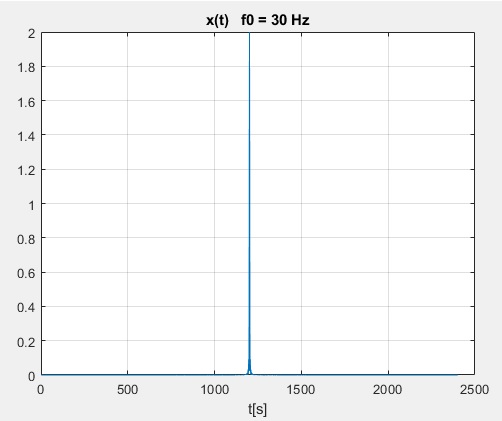
Try for instance f0=30

Now the signal x in time domain looks quite sharp

enter image description here

and in frequency domain the spectrum is clearly visible, no longer stuck on Y axis

enter image description here

Additiona Comments

4.-

To do x(0)=2 you just have to change the value in of the squared sinc front 4 to 2.

The reason

fun1=@(t) sinc(t).^2  % sinc(t)=sin(pi*t)/(pi*t)
integral(fun1,-Inf,Inf)

is

 =
   0.999999998051721

the area under a squared sinc from -Inf to Inf is already 1.

5.-

For whatever reason the direct definition of x as x=2*(sin(2*pi*f0*t)./(2*pi*f0*t)).^2

when through fft returns a bunch of NaN (Not a Number) nonsense.

Just use MATLAB function sinc instead . Function sinc was defined to avoid some particular f0 messing with too-close-to-zero or divide-by-zero errors that may end up producingNaN when obviously should be numerical values indeed.

6.-

The stem graph included in question may be X spectrum of x but DC shifted up by 1, which makes it infinite energy.

While the sinc (aka cardinal sin) input signal has finite energy.

$\endgroup$

Your Answer

By clicking “Post Your Answer”, you agree to our terms of service and acknowledge you have read our privacy policy.

Not the answer you're looking for? Browse other questions tagged or ask your own question.