1
$\begingroup$

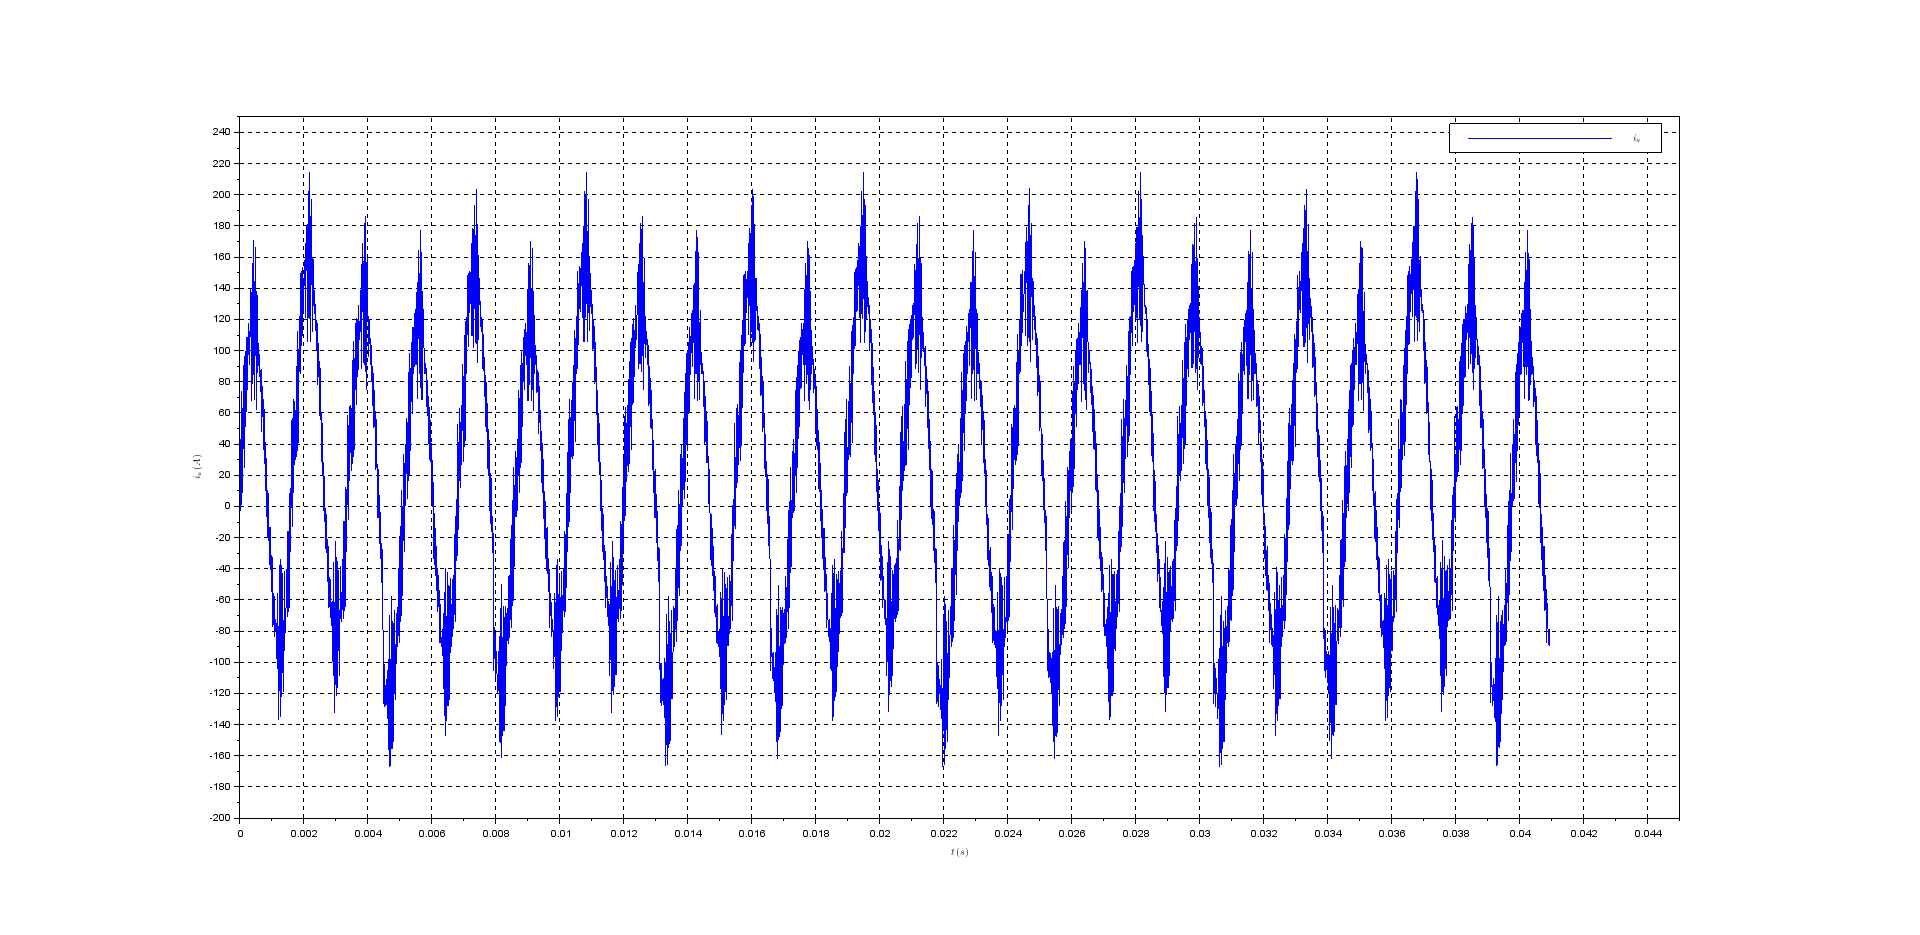
Consider the below given discrete signal which has been gathered via sampling of an analog current waveform with sampling period $T_s=100\,\mu s$.
I would like to evaluate the RMS value of its first order harmonic which has the frequency $f=58\,Hz$.

enter image description here

This task can be basically divided into two subtasks:

  1. Finding the first order harmonic
  2. Evaluating the RMS value

My question is whether I can use the below given formulas for finding the phasor of the first order harmonic ($N=f_s/f$):

$$A_1 = \sum_{k=0}^{N-1} i(k)\cdot \cos\left(\frac{2\pi}{N}\cdot k\right)$$ $$B_1 = -\sum_{k=0}^{N-1} i(k)\cdot \sin\left(\frac{2\pi}{N}\cdot k\right)$$ $$I_1 = \sqrt{A_1^2 + B_1^2}$$ $$\phi_1 = \arctan\left(\frac{B_1}{A_1}\right)$$

My doubts arises from the fact that in my situation $N=\frac{f_s}{f} = \frac{10^4}{58} \approx 172.4$

I have used the below given Scilab code for calculation of the $A_1$ and $B_1$ (supposing that the samples of the current are stored in the vector i_u)

N = 4096;
T = 1/58;
Ts = 0.0001;
M = round(T/Ts);
A1 = 0;
B1 = 0;
for k = 1:N
    A1 =   A1 + i_u(k)*cos(2*%pi/M*(k-1));
    B1 = -(B1 + i_u(k)*sin(2*%pi/M*(k-1)));
end 

This piece of my code calculated following values: $A_1 = - 85287.936$ and $B_1 = - 67.218679$ which don't make sense for me.

$\endgroup$
12
  • $\begingroup$ You don't care about the phase, so I'm not sure why you're calculating a phasor; your $I_1$ seems to be proportional to what you're looking for, an RMS. $\endgroup$ Commented Oct 5, 2022 at 2:12
  • $\begingroup$ Anyway, why does your N cause you any doubts? $\endgroup$ Commented Oct 5, 2022 at 2:13
  • $\begingroup$ @MarcusMüller thank you for your reaction. I have just added the source of my doubts to my question. $\endgroup$
    – Steve
    Commented Oct 5, 2022 at 5:36
  • $\begingroup$ These values are just that - values. Why do you think they make no sense? You've really not explained why you think your N is incorrect. $\endgroup$ Commented Oct 5, 2022 at 5:51
  • $\begingroup$ r.m.s. is: $$ \sqrt{\frac{1}{N} \sum\limits_{n=0}^{N-1} x^2[n]} $$ Make sure $N$ is big enough. $\endgroup$ Commented Oct 5, 2022 at 6:19

2 Answers 2

2
$\begingroup$

First of all, if you examine your plot carefully, there are 10 of the apparent periods in the time interval of 0.0172 seconds. But that really is two cycles of the apparent periodic function and the fundamental frequency is really about 116.3 Hz, and the 5th harmonic is about 581.4 Hz. The 5th harmonic is very very strong in relationship to the other harmonics.

Now you could call the 581.4 Hz your fundamental, but then the 116.3 Hz, which is present in your signal, is a sub-harmonic. But I'm gonna call it the fundamental and say there are no subharmonics and that your 581.4 Hz signal is the 5th harmonic.

So one entire period is 8.6 ms or 86 samples. Or you could get two entire periods of 17.2 ms or 172 samples.

Enter those two periods of data into an FFT of exactly $N$=172. Every odd-numbered bin should have very low energy, but every bin with an index that is a multiple of 10 should be pretty strong. The amplitude of that 5th harmonic is in the 10th FFT bin.

$\endgroup$
0
$\begingroup$

The RMS power of a cyclic signal is the RMS power of 1 CYCLE ONLY.

When calculating signals power we have to do our best to avoid mixing finite energy signals with periodic energy signals.

Sometimes it happens, mistaking a single pulse for something periodic, or missing a periodic signal as if once-only.

But then power measurements are rendered useless or misleading.

So before measuring signal power you need to calculate T the period of the signal first.

In the question you mention you know f1=58Hz but in general it's safer to extract the time period or cycle T from the signal directly.

That some one apparently reliable told you f1=58Hz ? good.

And the manual reads f1=58Hz ? better.

But ultimately the signal is the one you have to pay attention first, because it's the signal you are measuring, not others' statments or something printed on a manual that probably reached your computer through the internet.

So

1.- in time :

  • take many cycles and cut them between adjacent peaks
  • overlap all these cycles
  • average them

measure RMS power as told above on this single cycle.

As mentioned in another answer, the more cycles you take the better.

But run the RMS calculation along [t1:dt:t1+T] only

2.- In frequency :

  • you apply a window around the carrier measure power on the peak regardless of it's exactly 58Hz

Would you like a MATLAB script to show all above explained?

Just let me know and will add it to this answer.

$\endgroup$

Your Answer

By clicking “Post Your Answer”, you agree to our terms of service and acknowledge you have read our privacy policy.

Not the answer you're looking for? Browse other questions tagged or ask your own question.