My knowledge of analog and digital signal analysis is behind me.. thus I do not have enough confidence in my procedure to analyze my signal, and I do not know which direction to pursue to improve. I'm measuring a noisy square signal at a sampling frequency fs = 1e6 Hz. I can increase this frequency up to 1e9 Hz if needed.
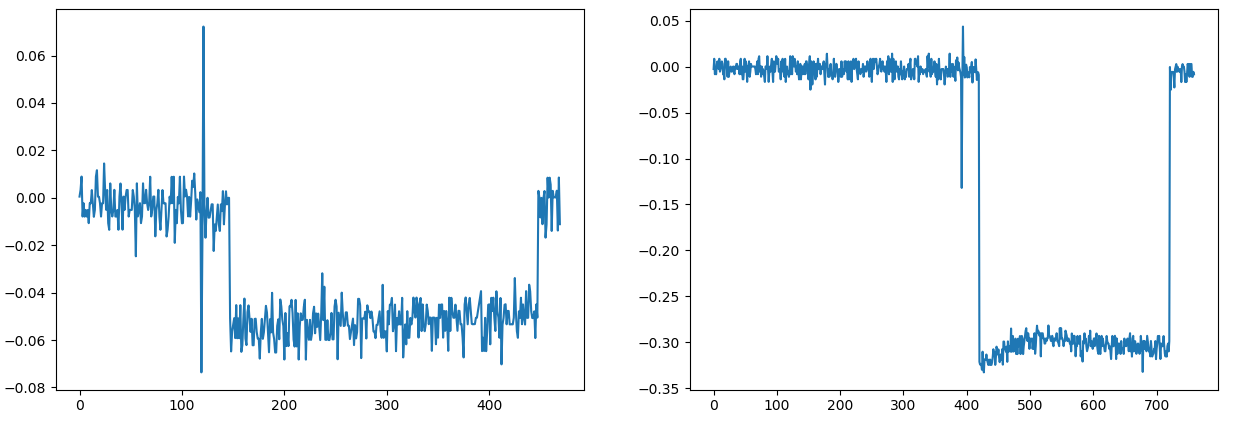
At a frequency fs = 1e6 Hz, I get the following signal:
Above, you can see 2 examples with 2 square waveforms at 2 different amplitudes. As you can see, the signal is prone to overshoot, in the example below, before the square starts; and is also noisy. Thus, I wanted to clean the signal by applying a low-pass filter.
I tried the 2 following: a Butterworth and a bessel filter using the scipy library in Python.
def butter_lowpass_filter(data, cutoff, fs, order=5):
    nyq = 0.5 * fs
    normal_cutoff = cutoff / nyq
    b, a = butter(order, normal_cutoff, btype='low', analog=False)
    y = lfilter(b, a, data)
    return y

def bessel_low_pass_filter(data, cutoff, fs, order=5):
    nyq = 0.5 * fs
    normal_cutoff = cutoff / nyq
    b, a = bessel(order, normal_cutoff, btype='low', analog=False)
    y = lfilter(b, a, data)
    return y
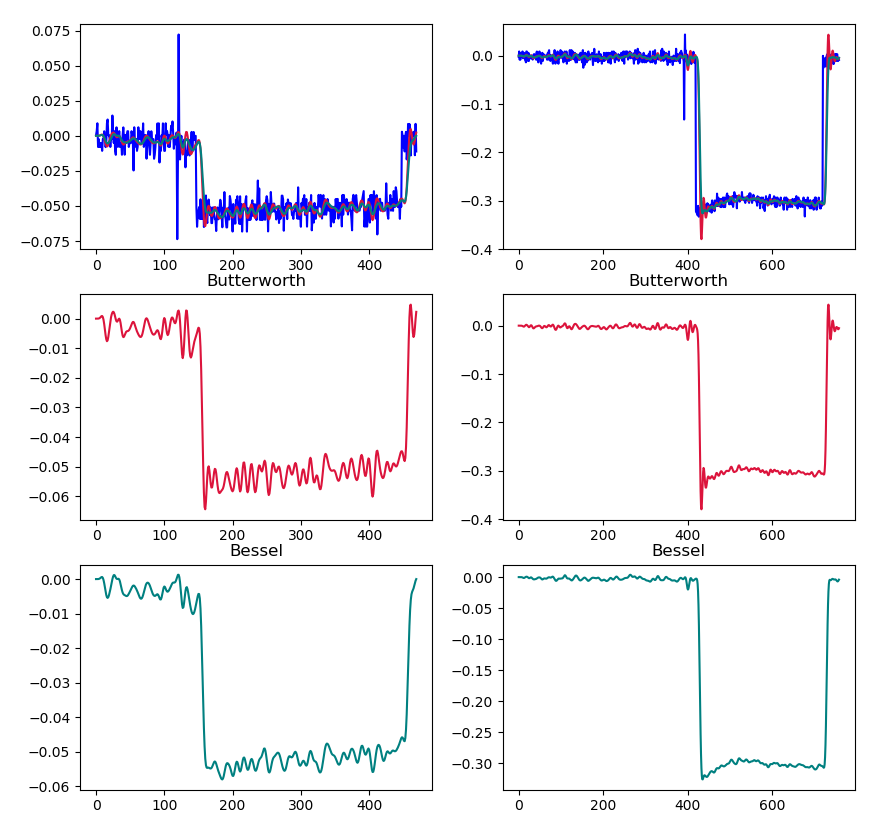
I then call both filters on my data with the settings cutoff = 100000 # Hz, fs = 1e6 # Hz, order = 8. Why those settings? That is my first problem, I don't really know how to choose the cutoff frequency or the order. I simply tried different values, and those seem to be nice.
The result looks like this (left, low amplitude pulse; right, higher amplitude pulse):
The bessel filter seems to work better than the Butterworth, however both have the same problem. The signal is shifted to the right. If I zoom , I observe the clear shift:
The opposite shift seems to be present at the end of the square. Is it possible to correct this shift? My end goal is to measure both the amplitude and the width of the square. Do you think my approach is correct or would you recommend me another approach?
Thanks for the guidance, Mathieu


