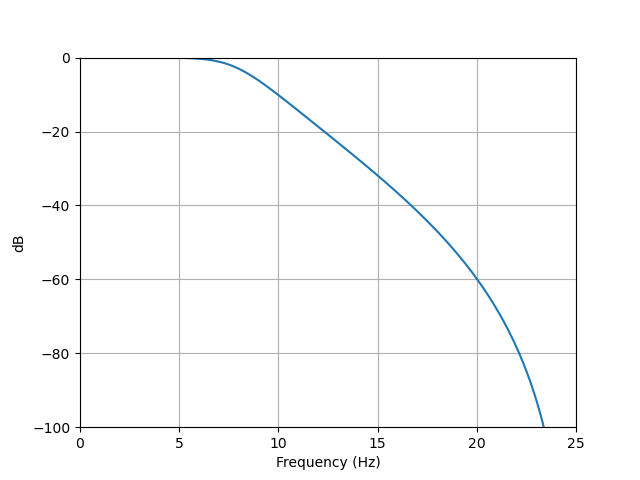
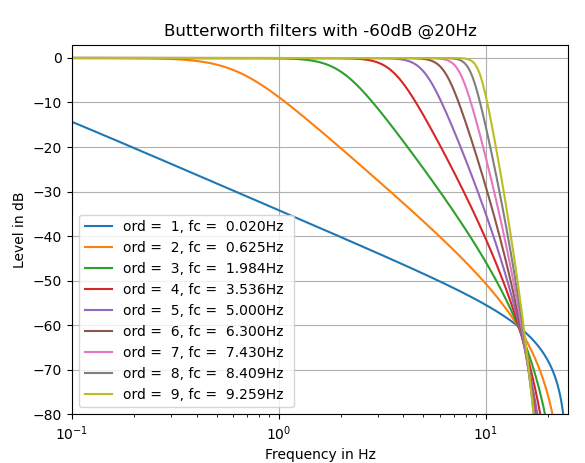
I am relatively inexperienced with respect to lowpass filters, but I am trying to replicate parts of this paper, which deals with the processing of 3D accelerometer and 3D gyroscope data, both from the same IMU. The data has been collected at 50Hz (see p.5). A little bit later on p.5 it says that the data
is smoothed with a Butterworth low-pass filter (-60db at 20Hz).
No information about the order is given.
I code in Python so I am using Scipy's (v1.1.0) signal.butter (documentation), which requires to set
- order
N - critical frequency
Wn - analog or digital
- type of output
I found in the answer to this post, that I should use analog=False since my data has most likely been sampled regularly, which is what I expect from an IMU. However, I am very uncertain what is meant by
-60db at 20Hz.
I assume the cutoff frequency fc to be 20Hz, because the sampling frequency fs is stated in the paper as 50Hz.
Providing a time series snippet (only 1D for simplicity) for reproduction, this leaves me with this code:
import matplotlib.pyplot as plt
from scipy import signal

data = [-1.0436051383321092, -1.0505922388438984, -1.054092916480489, -1.0594615377516436, -1.0528397348040082, -1.0265495609876023, -1.0030861099986423, -1.0092599433155374, -1.0249089063356631, -1.0140387164631766, -1.0056669772119422, -1.0036560772602825, -0.9996307058908602, -0.9938863276199182, -0.9736733666046808, -0.9614502798619106, -0.9721199408045632, -0.9823970563524684, -0.9922003136484135, -1.0105170817955498, -1.0230552960961752, -1.0126115584815136, -0.9965836060956084, -0.9722516530084516, -0.9739932157698056, -0.9672539544164604]

fc = 20  # cutoff frequency ?
fs = 50  # sampling frequency

sos = butter(N=2, Wn=20/(50/2), btype='lowpass', analog=False, output='sos')  # not sure about the order N
filtered_data = sosfilt(sos, data)

plt.plot(data)
plt.plot(filtered_data)
plt.show()
Now I have three questions, which aim at finding out whether I replicated the filter correctly:
Is there a way to infer
Nform the information given by the paper? I know that there is scipy.signal.buttord but I am afraid that the paper does not provide sufficient information to assign all required arguments.What is meant by "-60db at 20Hz"?
Is it correct to use
output='sos'and, subsequently,scipy.signal.sosfiltfor smoothing this kind of data (6-dimensional IMU)?


