5
$\begingroup$

I have the strain signal of a lateral beam of a car measured at sampling rate 1,200Hz from data acquiring system. Even after using temperature compensation in strain gage, we are getting drift. So I wanted to remove drift in post processing of the strain signal. I have tried using High pass filter (HPF) of order 10th with cutoff freq = 200Hz, but I am losing peaks of the strain signal. So HPF is not useful.

Which filter is suitable to remove drift for strain signals? considering the fact that I want to retain peaks and what other methods I can use to remove the drifts?

Also, what are the exact factors to consider in choosing the cutoff frequency for HPF? and how to check it is correct?

I have attached the strain signal and HPF filtered signal of 10th order.

strain signal

HPF filtered signal

$\endgroup$
3
  • $\begingroup$ I was googling for DC blocker and just happened to come across this post. I've been working on a school project involving using strain gauge to measure certain signals, but the results are always drifting. $\endgroup$
    – user27406
    Commented Mar 21, 2017 at 4:50
  • 2
    $\begingroup$ x = filter([1 -1], [1 -0.998], x); $\endgroup$ Commented Mar 21, 2017 at 5:30
  • $\begingroup$ @user27406 You can use DC blocking for strain signals and it can be realized in hardware as well. If you are interested, further you can check out new filter method called "The Most Crossing Method", link infrawatch.liacs.nl/SCHM-Miao.pdf $\endgroup$
    – Binoy D
    Commented Mar 21, 2017 at 13:12

2 Answers 2

6
$\begingroup$

The usual first approach to this is to use a DC Blocker: $$ y[n] = \alpha y[n-1] + x[n] - x[n-1] $$ where $0 < \alpha < 1$, $y$ is the DC blocked signal and $x$ is your original signal.

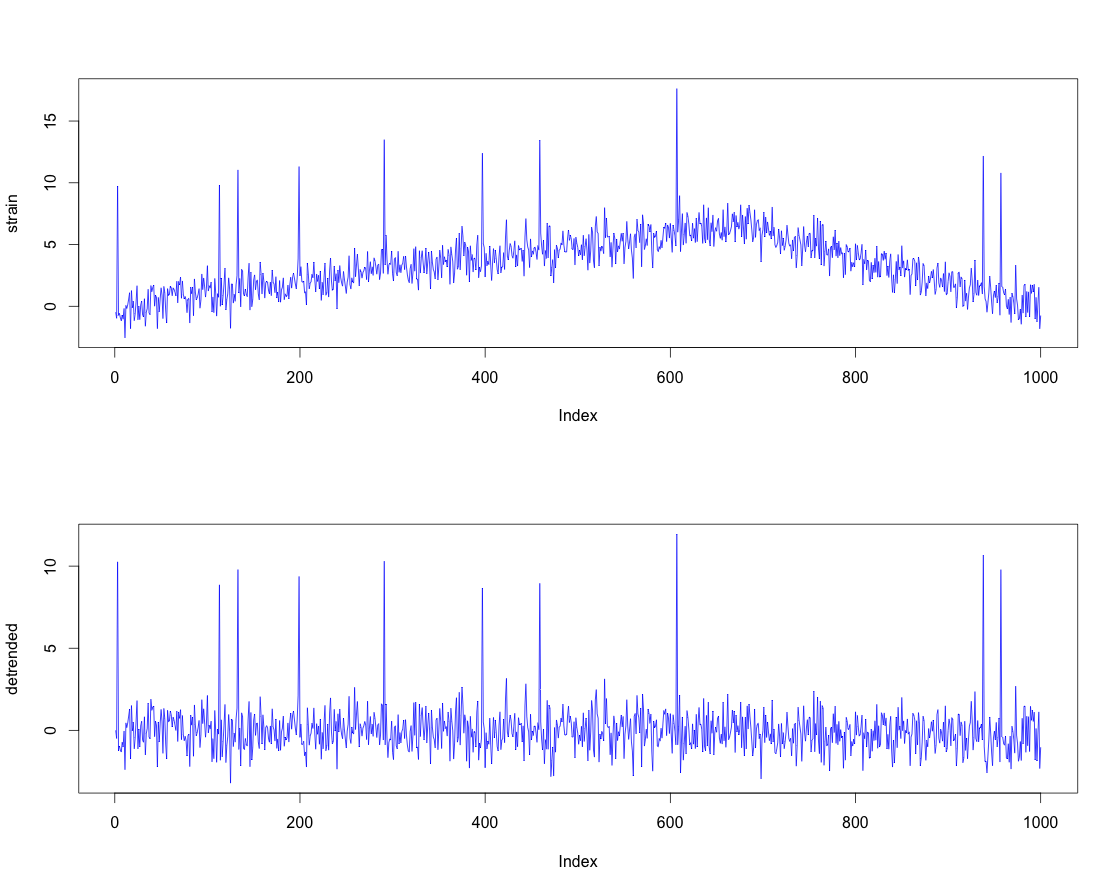
If I simulate your signal and apply the DC Blocker to it, the results are in the figure below.

It should preserve the peaks well.

R code to implement it below.

enter image description here

How to choose $\alpha$ ?

This really depends on what you are going to use the data for later. If it's a control application, then phase is probably important to you.

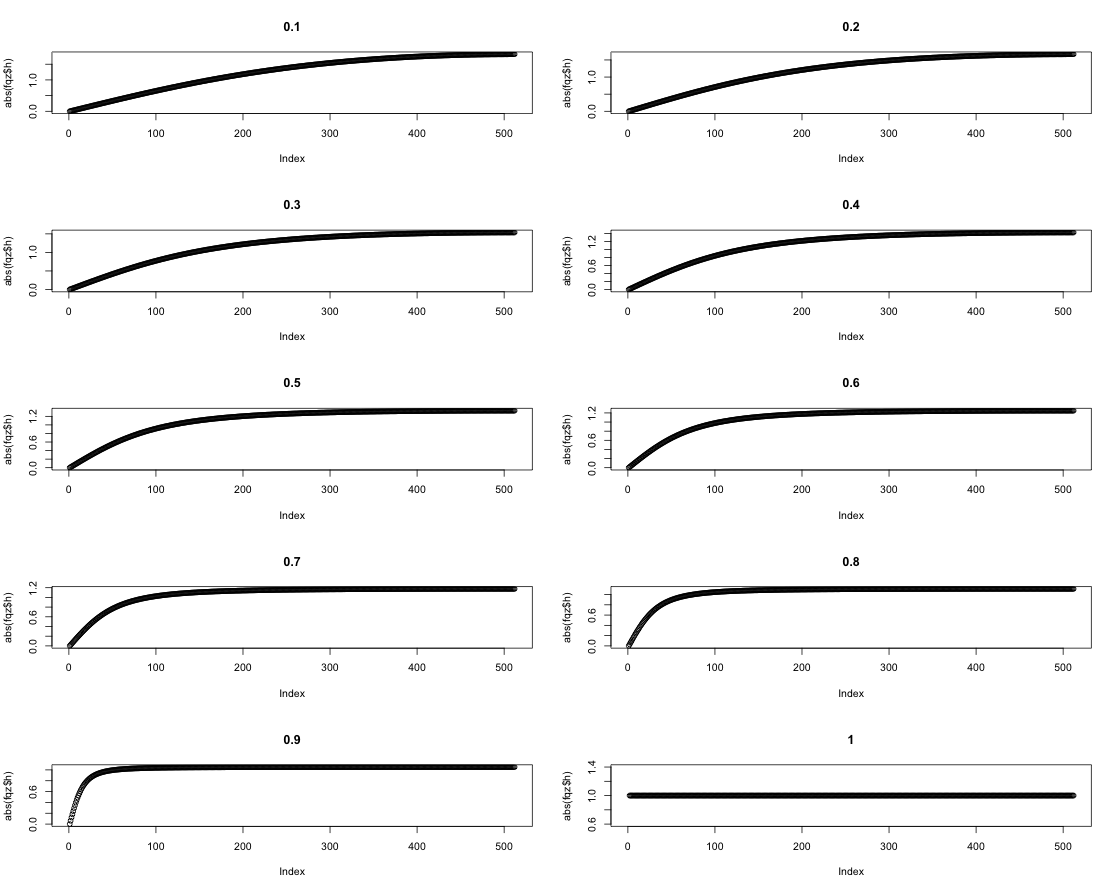
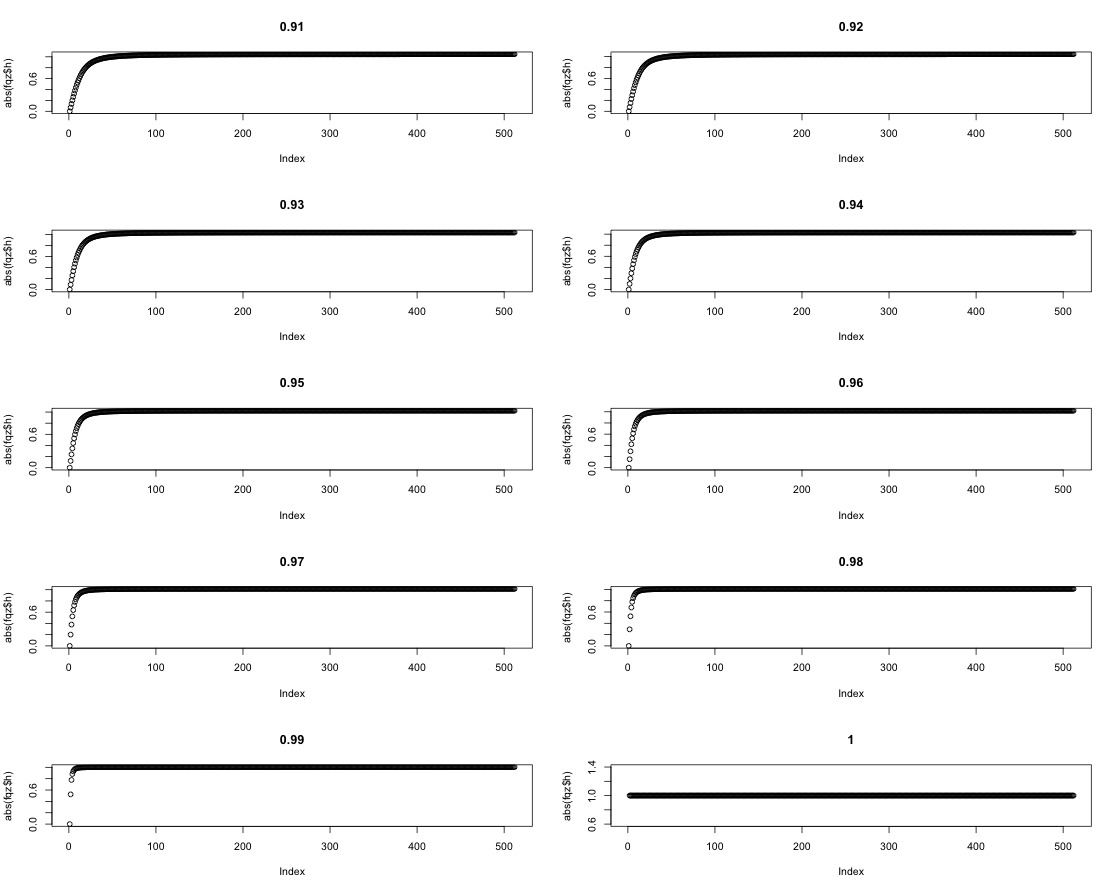
More generally, you want to JUST remove the DC component and not much else. In that case, just look at the magnitude frequency response of the filter.

As you can see from the plots below, low values of $\alpha$ (less than $0.9$ tend to have a bigger impact on the lower frequencies. Hence, I tend to use values of $\alpha$ between $0.9$ and $1.0$.

enter image description here

enter image description here


R Code Below

#27468

T <- 1000
Npeaks <- 10

idx_peaks <- runif(Npeaks,1,T)

strain <- rnorm(T) + c(seq(1,2*T/3,1) ,seq(2*T/3+1,0,-2))/100

strain[idx_peaks] <- strain[idx_peaks] + 10

detrended <- 0*strain
alpha <- 0.9

for (k in 1:length(strain))
{
  if (k>1)
  {
    detrended[k] <- alpha*detrended[k-1] + strain[k] - strain[k-1]
  }
  else
  {
    detrended[k] <- 0
  }
}

par(mfrow=c(2,1))
plot(strain,col="blue", type="l")
plot(detrended,col="blue", type="l")
$\endgroup$
6
  • $\begingroup$ Thank you so much. I checked your method in MATLAB. It worked and filtered signals is suitable for my further mechanical analysis. I am Mechanical Engineer, new to DSP. You saved me big time. Appreciate your help! $\endgroup$
    – Binoy D
    Commented Dec 4, 2015 at 8:46
  • $\begingroup$ You're very welcome. Thanks for the tick! $\endgroup$
    – Peter K.
    Commented Dec 4, 2015 at 12:17
  • $\begingroup$ I did not know about this simple filter, grateful you provided the reference. Do you know of methods for guessing an appropriate $\alpha$? $\endgroup$ Commented Dec 4, 2015 at 19:19
  • $\begingroup$ @LaurentDuval : That really depends on your application. I've generally found values between 0.9 and 1.0 are best. See my update. $\endgroup$
    – Peter K.
    Commented Dec 4, 2015 at 19:51
  • 2
    $\begingroup$ @Laurent Duval for further understanding about DC blocker you can refer following link. It contains pdf document which explains the choosing of alpha based on your cut-on frequency. $\endgroup$
    – Binoy D
    Commented Dec 17, 2015 at 21:22
1
$\begingroup$

Your drift issue may have other names: drift, trend, background, baseline, continuum, etc. The names above may widen the search Hence it has been addressed by many methods, in different domains.

Appropriate solutions may depend:

  • on what you call drift: the slow trend, or the added noise as well?
  • on what noise properties do you rely: Gaussian, spike-like?
  • on what signal properties do you rely: band-pass, positivity, sparsity?

In a word, what is your model? Combining all them, one can come out with a morphological, or a variational formulation leading to efficient algorithms. One of those combines an high-pass filter, a relative symmetry of the signal, and the sparsity of its derivatives, see for instance (shameless plug) BEADS: Baseline Estimation And Denoising with Sparsity. A few existing SE.DSP discussions follow:

$\endgroup$

Your Answer

By clicking “Post Your Answer”, you agree to our terms of service and acknowledge you have read our privacy policy.

Not the answer you're looking for? Browse other questions tagged or ask your own question.