1
$\begingroup$

Let's say we have a white noise as input. Total RMS value is -20dBFS.

When I apply a parametric filter at 250Hz with Q = 4 at 3dB boost, what will be the final total RMS of the signal? How can I calculate that?

Is it same with the shelvings?

I have IIR coefficients of filters and an Excel table that plots the transfer function with given BW resolution. Standart dB summation formula looks like not correct.

Also an additional question. In BW equations, corner frequencies are stated as 3dB lower that the center frequency. But when I apply a 1/3 BWn parametric eq with 5dB gain, corner frequencies are about 2,35dB. What is that I'm missing?

EDIT BASED ON HILMAR'S ANSWER

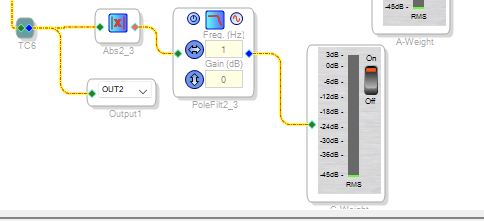
Firstly I've run a whitenoise into ADAU1772 devboard. I'm monitoring signal as this;

dBreg Monitor

When I apply eq with huge boosts like 10dB, 20dB; result changes only 1-2dB (frequency below 1kHz). When fc of the eq is above 10kHz, changes are shown more alike.

@Hilmar; since I've not enough knowledge in signal processing equations, I'm having trouble to implement the equation. In third Pg equation, I understand that, I will sum every sample of the filter gain^2, but not in dB, as in linear value? And will divide that into sample count? It looks like dB average formula.

I've tried in my excel with 100Hz, Q= 1,414214, Boost = 3dB; 501 samples (10Hz-23kHz; BWn~1/30)

Step 1: Calculated all samples linear value^2; $=(10^{Bant1_dB/10})^2$

Step 2: Sum(all above) Step 3: Divide result to 501 (sample count)

Result is; 1,26. I convert it to dB again with 10*LOG10(1,26), so It looks like 1,01dB. Is this ok?

I changed the Q to 0,1, and the result is 2,48(linear); 3,95dB.

And how is input signal is important? Isn't that to total added gain of the transfer function?

EDIT FOR CLARIFICATION OF THE QUESTION

For a usage example; my gain structure is transmitting 0dBu analog signal from DSP to power amplifier in pink noise. After some equalizer filters (i.e. for room tuning), I'll boost or cut some bands. So I need to calculate new signal level in dBu to re-arrange my gain structure.

EDIT 3: RESULTS BASED ON TESTS

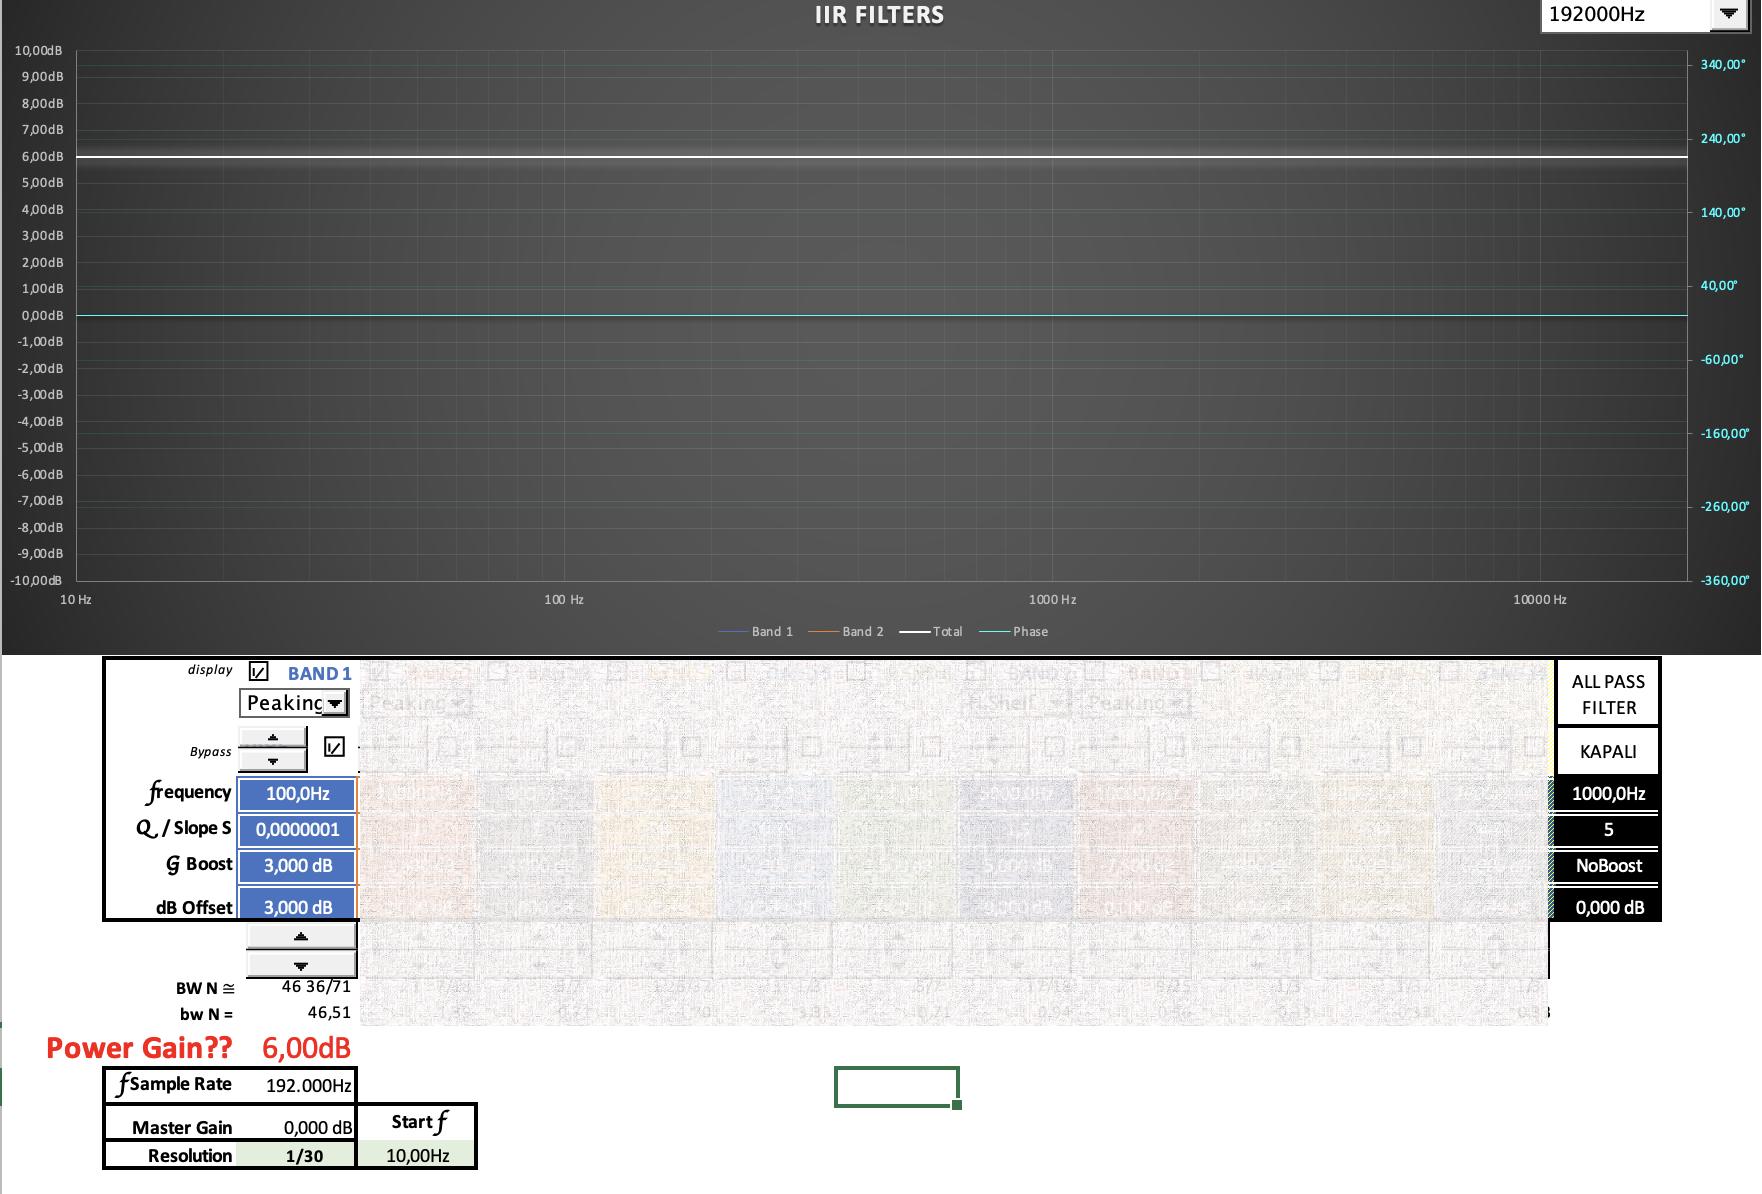
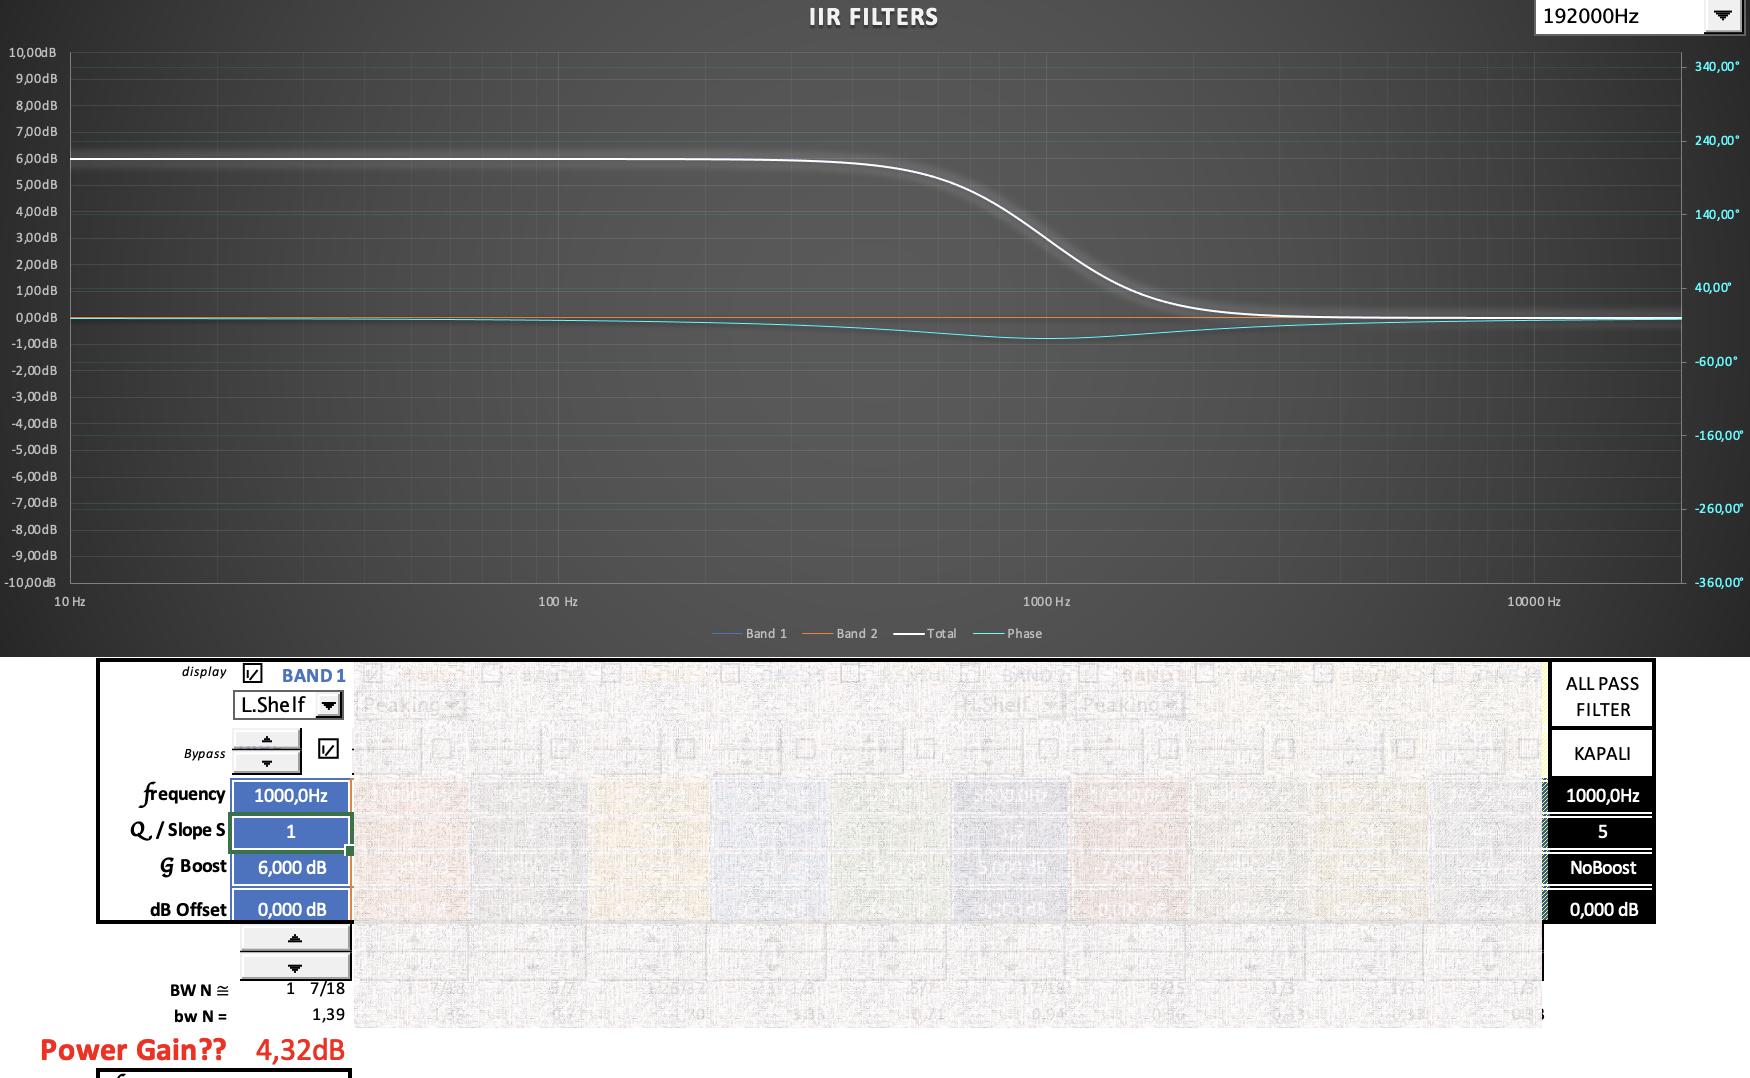
I had to edit the formula as below, because 3dB offset gain (0dB boost) has the result of 6dB Power Gain. So I just rearrange dB to linear conversation from $10^{H/10}$ to $10^{H/20}$ .

On the transfer function array, I used formula below;

=10*LOG10(SUM(IF(ISNUMBER(Table4[Band 1]);(10^(Table4[Band 1]/20))^2))/COUNT(Table4[Band 1]))

As a conclusion; is this power gain the parameter what i need to add dBu output of the DSP? (If my calculations are correct.)

Last one is: Are there any other formula to calculate this power gain without sampling the transfer function, just to use frequency, filter type, Q and boost?

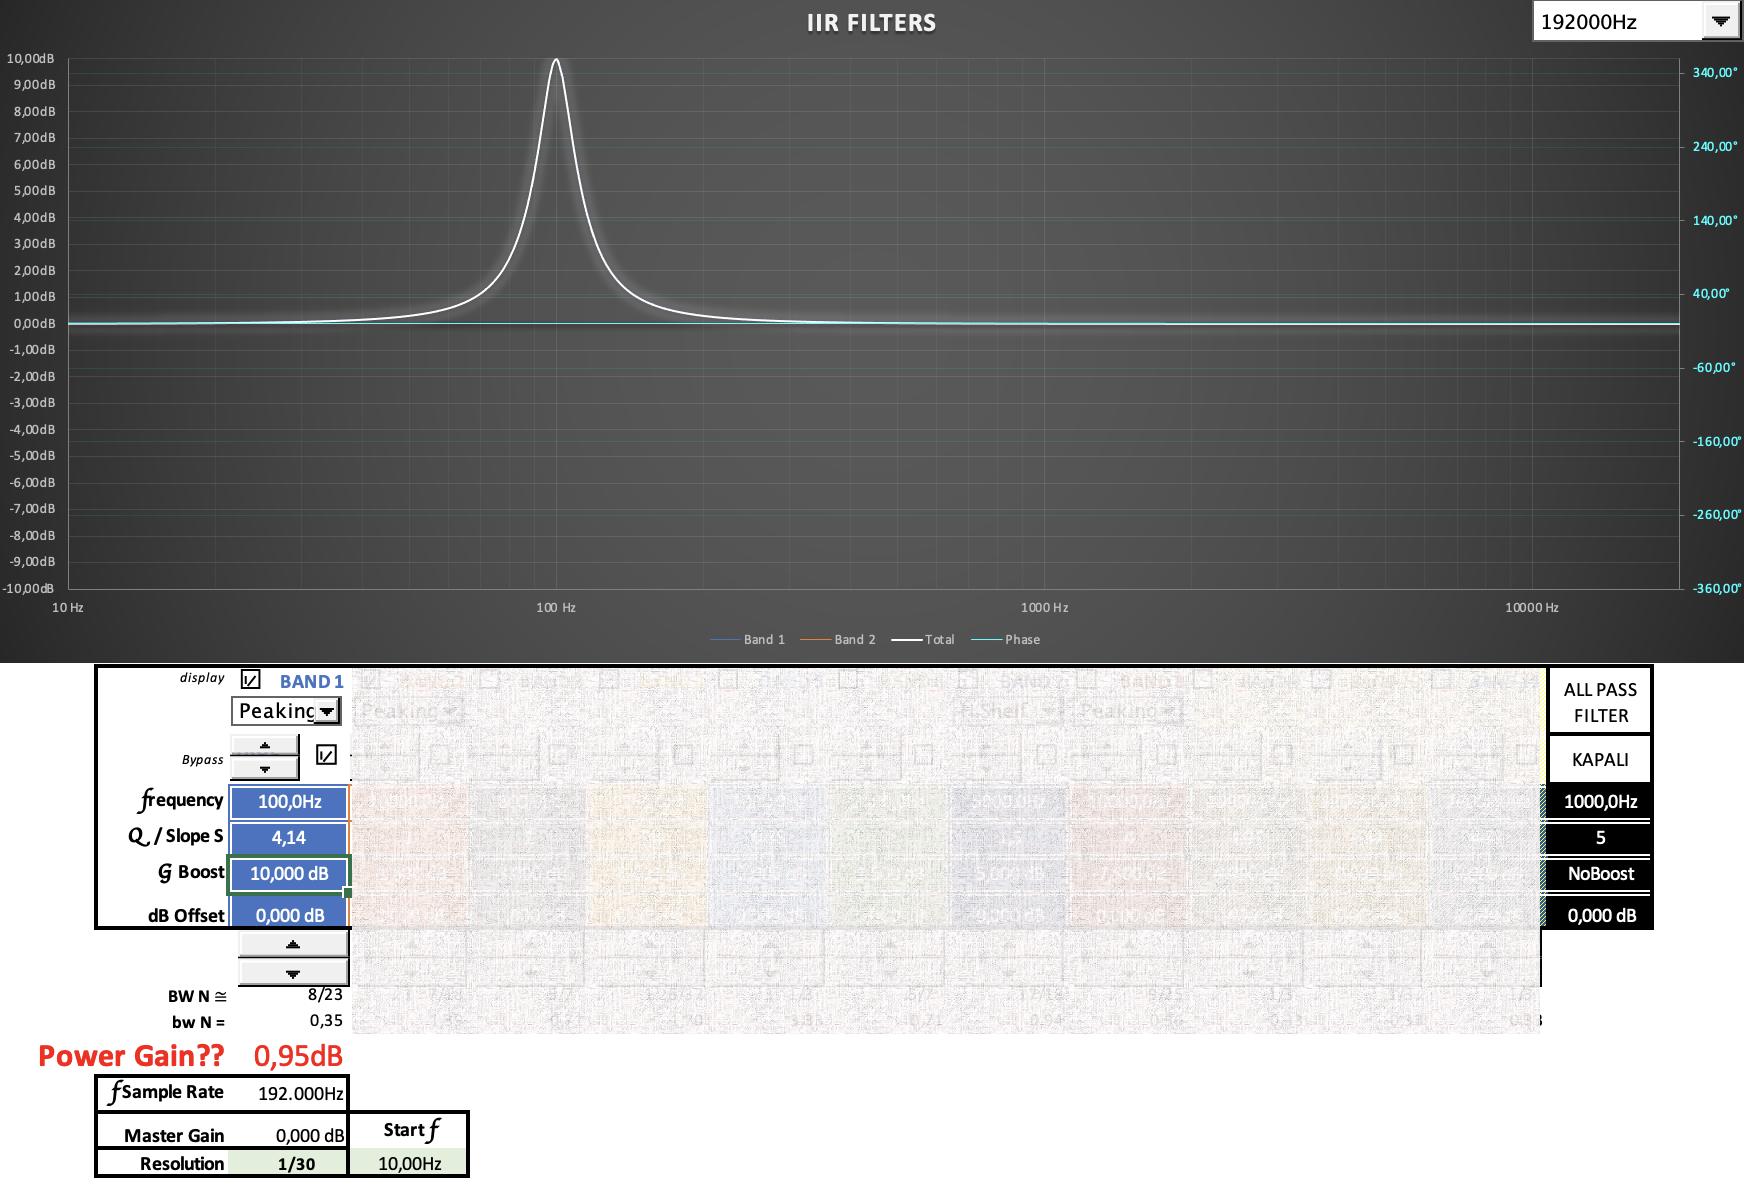
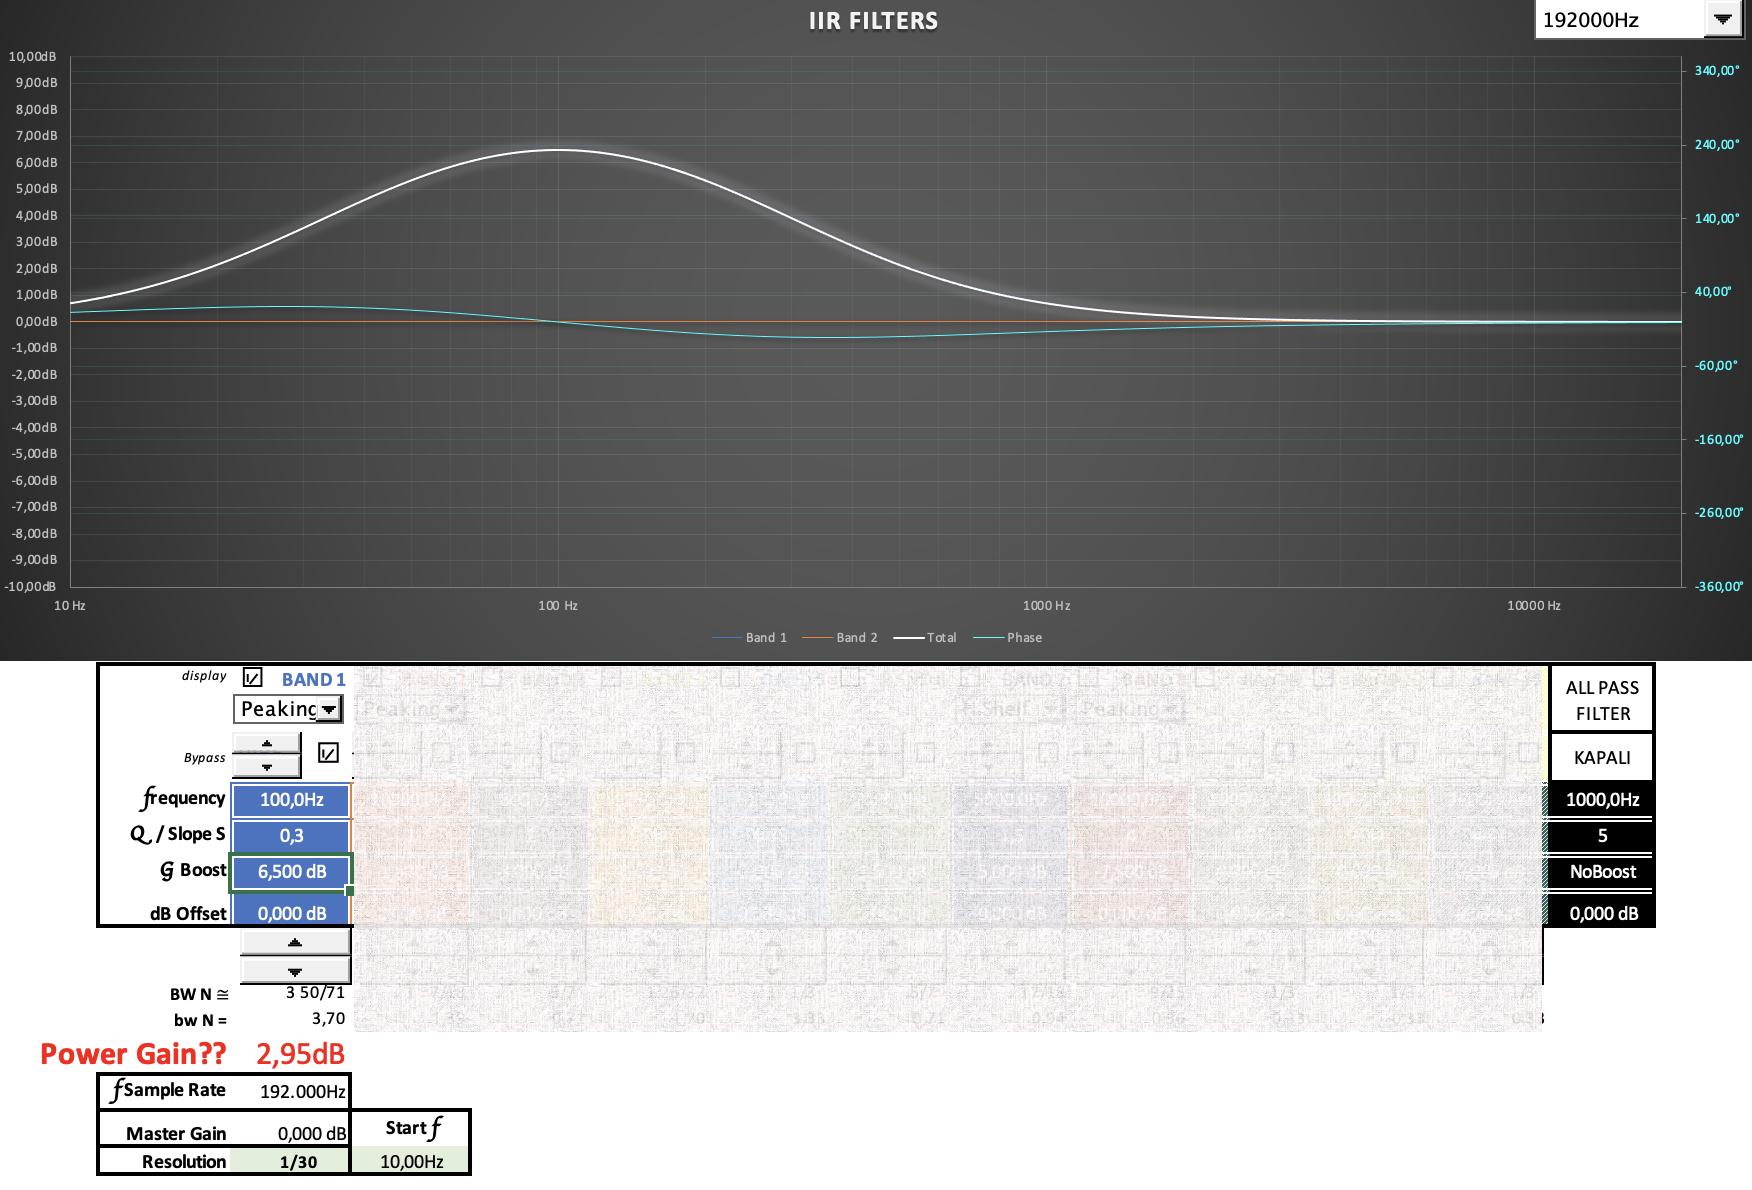
So here is some of the results I get with given values in the screenshots;

powergain 1 powergain 2 powergain 3 powergain 4

$\endgroup$
10
  • $\begingroup$ I think you can calculate the energy of the impulse response of an IIR filter, which is also known as filter norm, and then convert it to dB. $\endgroup$
    – ZR Han
    Commented Oct 8, 2022 at 2:12
  • $\begingroup$ There's this Excel file on musicdsp.org you might want to study (if not yet done it) ... : musicdsp.org/en/latest/Filters/… $\endgroup$
    – Juha P
    Commented Oct 9, 2022 at 5:25
  • $\begingroup$ @JuhaP, actually I did, thanks to that excel I implement my design quickly in excel. But my main question was to calculate "total added gain" after the filter. $\endgroup$
    – BugraKezan
    Commented Oct 9, 2022 at 10:52
  • $\begingroup$ @ZRHan, I've checked the link, but I couldn't understand a lot but final equation is different than Hilmar's answer. They both sum of squares but, Hilmar's equation is dividing result to sample count. In filter norm, it takes its square root. $\endgroup$
    – BugraKezan
    Commented Oct 10, 2022 at 9:02
  • $\begingroup$ @BugraKezan The first three equations in Hilmar's answer give the power in time domain and frequency domain respectively. filternorm calculates $\ell_2$ norm which is square root of the filter energy. The relationship between power and energy yields the division by sample count (time). $\endgroup$
    – ZR Han
    Commented Oct 10, 2022 at 11:17

2 Answers 2

2
$\begingroup$

There are multiple ways to look at total added gain. For example

  1. Power gain
  2. Peak gain in the frequency domain
  3. Peak gain in the time domain

Let's start with the first which is the trickiest since it's is highly dependent on the input signal so there is no easy generic answer.

Assuming you have a signal $x[n]$, output $y[n]$ and transfer function $h(n),H(z)$ the easiest way of determining the gain is simply running the signal through the filter.

$$P_g = \frac{\sum (x*h)^2[n]}{\sum x^2[n]} = \frac{\sum y^2[n]}{\sum x^2[n]} $$

There aren't a whole lot of ways to simplify that. You can sample the transfer function on a "sufficiently dense" frequency grid and then do a weighted sum, i.e.

$$P_g = \frac{\sum_{k=0}^{K-1} |H(\omega_k)|^2\cdot |X(\omega_k)|^2}{\sum_{k=0}^{K-1} |X(\omega_k)|^2}$$

For something like white noise you can assume $|X(k)| \approx 1$ and than simplify to

$$P_g = \frac{1}{ K} \sum_{k=0}^{K-1} |H(\omega_k)|^2$$

You can do similar things for "standard" signals such as pink noise or a sine wave, but there is no generic answer.

Peak gain in the frequency domain is typically a design parameter for the filter, so that one is easy

Peak gain in the time domain is bounded by

$$ \frac{y_{max}}{x_{max}} \leq \sum |h[n]|$$

whether that's an realistic estimate or not depends on the application.

In BW equations, corner frequencies are stated as 3dB lower that the center frequency

This only makes sense for low pass and high pass filters. For most other filter types this doesn't work. What's the bandwidth of an allpass or shelving filter? That's why $Q$ is used to define the "sharpness" of the transition between the very low and very high frequency states.

$\endgroup$
3
  • $\begingroup$ I've update my question based on your answer. Thanks by the way. If I'm not so wrong it makes some sense to me :) $\endgroup$
    – BugraKezan
    Commented Oct 10, 2022 at 14:02
  • $\begingroup$ Besides other question, I have one more about the peak gain in the time domain. How can ymax/xmax can be equal to total of transfer function? $\endgroup$
    – BugraKezan
    Commented Oct 11, 2022 at 17:40
  • 1
    $\begingroup$ It max time domain gain is equal or smaller than the absolute sum of the impulse response. If you want a proof of that, ask a different question (since it's complicated) $\endgroup$
    – Hilmar
    Commented Oct 12, 2022 at 8:06
0
$\begingroup$

I don't know if I must just edit my question or post a new answer but here it goes.

For something like white noise you can assume |𝑋(𝑘)|≈1 and than simplify to

Based on @Hilmar's answer, I run the equation and assume that my input signal is pinknoise not white noise. I think there was a confusion about it. Pinknoise's function should be almost equal in all frequencies and white noise should have less energy at low frequencies.

I run the formula in excel at 1/30 octaveband resolution of transfer function and calculated all example filters "hopefully" power gain.

Then, I tried every filter on the DSP with real signal and a Class-1 analyser at the output (NTI Minirator MR-PRO and NTI XL2 Analyser) with white and pink noises for each filter. All measurements have been done in Z-weighted, different time-weighted results.

PinkNoise resulst were as expected. Max deviation of the averages was 0.1dB from the calculation (really in the tolerance of Class-1 range). And of course, in white noise, there is huge deviations very depended on the frequency as Hilmar explained.

PinkNoise Results

WhiteNoise Results

Since my main aim was the predict the change of RMS level of the flat signal, I believe this PowerGain equation will provide it. And because of the dependency of the input signal's frequency response maybe we can assume the peak gain of the transfer function will be the limit.

So, after eq filters, I can hopefully say that, power gain of the transfer function is the "-Gain" parameter which I should apply to my DSP to keep the gain structure of my whole system same enough.

I still wonder, if there is another equation to calculate this power gain without sampling the transfer function, just enrty of Q, Boost, maybe fc, etc..??

$\endgroup$

Your Answer

By clicking “Post Your Answer”, you agree to our terms of service and acknowledge you have read our privacy policy.

Not the answer you're looking for? Browse other questions tagged or ask your own question.