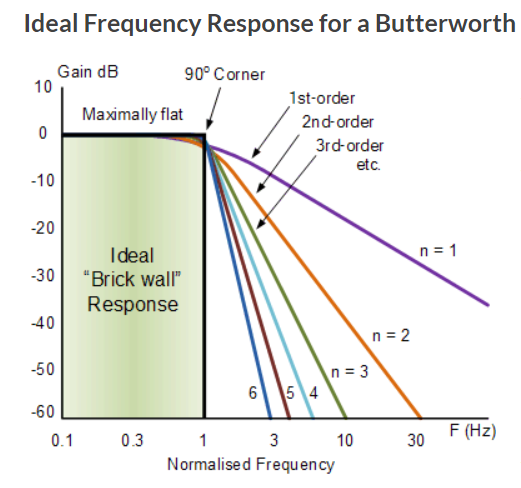
an $n$th-order Butterworth filter in the $s$-domain has a magnitude function that is two straight lines connected with a soft corner at $\omega_0$ and -3 dB. the straight line at the left is a flat 0 dB but the line on the right (assuming you're looking at log frequency and dB) has a slope of $-20n$ dB/decade drop. That is the same as $-6n$ dB/octave drop, if you like your log frequency in units of octaves. So you have to figure out if the drop is steep enough too whack the frequency components you want whacked.
$$ \Big| H_n(j \omega) \Big|^2 = \frac{1}{1 + \left(\frac{\omega}{\omega_0}\right)^{2n}} $$
$$\begin{align}
20 \log_{10} \big| H_n(j \omega)\big| &=-10\log_{10}\left(1 + \left(\tfrac{\omega}{\omega_0}\right)^{2n}\right) \\
\\
&\approx \begin{cases} 0 \qquad & \omega \ll \omega_0 \\ -10\log_{10}\left( \left(\tfrac{\omega}{\omega_0}\right)^{2n}\right) & \omega_0 \ll \omega \end{cases} \\
\\
&= \begin{cases} 0 \qquad & \omega \ll \omega_0 \\ 20 n \log_{10}( \omega_0) - 20 n \log_{10}( \omega) & \omega_0 \ll \omega \end{cases} \\
\\
\end{align}$$

