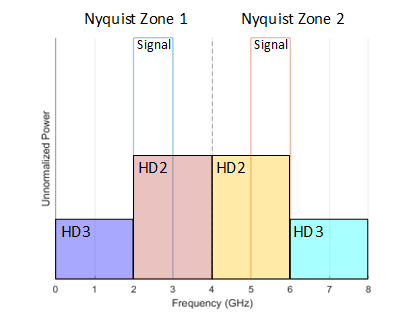
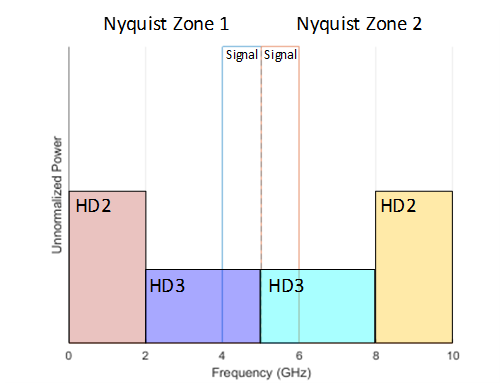
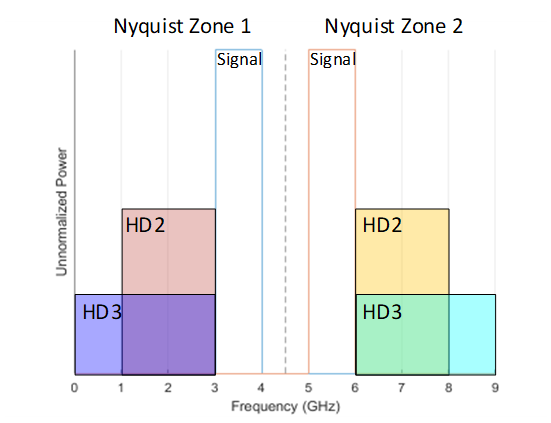
Frequency Planning in Radio Design
The OP has clarified in comments that his question is focused on what would I believe would be commonly referred to as frequency planning in the process of radio design. In such frequency planning, all the known (and predictable) possible intermodulation locations are determined due frequencies due to clocks and local oscillators used, and center frequencies of other (relatively narrowband) modulated signals. The intermodulation signals would typically show up as narrow band tones, called "spurs", limiting radio sensitivity if a spur were to fall into a used frequency band for reception. For this reason such frequency planning is often used for receiver design to determine "clean bands" for use of intermediate frequencies (IF) but also can be used to avoid signal degradation in a transmitter by avoiding the possibility of in-channel distortions. With consideration to the intermodulation from a single modulated waveform alone, this really doesn't make sense as I detail in the next section-- the products due to the signal itself will already unavoidably be in band. However if there are multiple different relatively narrow band channels and other sources of strong spurious signals (clocks), then such an analysis of clear frequency bands can be worthwhile if we have the option of choosing alternate frequency bands and within the range of the DAC and the DAC sampling rate itself (frequency planning!).
The intermodulation spurs are predictable, for example for two frequency components all the spurs would as all components would land at $mf_1\pm nf_2$ for all integers $m,n$, where the spurs would be progressively weaker for larger $m$ and $n$ values. Charts called "mixer spur charts" exist for this very case of two frequencies (given the two frequencies going into an analog mixer, which is a multiplier, as the "LO" or local oscillator, and "RF" or radio frequency input.). So in this case $mf_1$ refers to the LO and all its higher harmonics, and $nf_2$ refers to the RF frequency and all its higher harmonics. Due to non-linearities within the mixer, all spurs appearing at the IF (Intermediate Frequency) output would be predictably at $mf_1\pm nf_2$. When the RF port is a modulated signal, the spurs would also be modulated with increasing bandwidth proportional to $m+n$, and thus all locations where additional noise can be introduced is predicted. A DAC and ADC works very much the same as a mixer; multiplying the signal with an impulse instead of a sinusoid (and filtering with staircase reconstruction in the case of a DAC). The point is we have the same effect (even more some) of all the harmonics of the sampling clock as $mf_1$. An example mixer spur chart from Microwaves 101 is shown below, demonstrating its use to determine frequency bands that would be clear of possible intermodulation noise. This particular one is plotted showing the results with just the $n$ values of 0,1,2,3,4 and $m$ values of -2, -1, 0, 1, 2. As we add more coefficients, more lines would appear, and we expect the lower numbers to be more dominant. The actual magnitude would depend on the coefficients of the specific non-linearity introduced, but this at least shows us the frequency locations where the stronger intermodulation spurs can appear so that we can avoid use of them if possible).
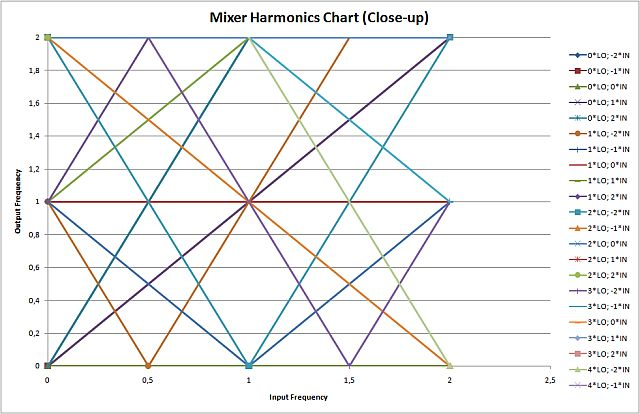
This chart drawn is with normalized frequency with 1 on the vertical axis representing the frequency of the LO (the sampling clock in the case of a DAC), and 1 on the horizontal axis representing the frequency of the RF input (for a mixer; for the DAC this would be the frequency of the signal to be converted to analog). For the case of a DAC, the first Nyquist zone would be the square region represented by Input Frequency from $0$ to $0.5$ and output frequency from $0$ to $0.5$, but we also see that all the higher output frequencies that will exist can also be predicted if there was interest in that.
With that, the horizontal line that results with a constant 1 independent of RF frequency is the LO or clock feedthrough that we would expect to see. This would refer to component predicted by $m=1$ and $n=0$. The other lines show the results for the other combinations of $m$ and $n$, and ultimately we can draw a vertical line for a given input RF frequency, and for that frequency read directly the clear output frequency bands that don't have any spurs (for the range of $m$ and $n$ used to create this chart).
The link provided also provides an example spreadsheet for creating such charts that will provide further guidance into such analysis. For the case of a mixer where two frequencies are considered, the result is given by $mf_1 \pm nf_2$ as previously described. This is readily expanded for consideration of multiple frequencies by doing $mf_1 \pm nf_2 \pm kf_3 \ldots$. The viability of having free usable areas will go down as the range for each of the integers $m,n,k \ldots$ are increased, so in creating such a chart or analysis keep in mind that the total order of the intermod product is given by $m+n+k + \ldots$ and the total power will both go down as the order goes up and the overall bandwidth (if one or both of the signals is modulated) will spread by the order. Thus the locations of all the lower order results (up to 5th order would be reasonable to review) should be prioritized for avoidance.
An actual "chart" with more than one input frequency (which is what is desired in this case) would become multi-dimensional so a programmatic search rather than graphical solution would make more sense; but if a dynamic 2D chart was desired for further insight, that could be done by sweeping any one of the frequencies as the horizontal axis with all the other frequencies set to fixed locations (as determined from their own sweeps), and this is iterated. I have pursued this programmatically where the search results in the largest free zones within a certain total order, where order is the sum of all the individual harmonic orders and typically with a total sum < 5 has been sufficient to identify the possible spurs but is dependent on severity of the actual non-linearity.
Distortion due to intermodulation in modulated waveforms
Below is my prior answer focused on the intermodulation effects within a modulated waveform itself.
Unless the OP is only ever converting a single tone, the harmonics due to non-linearities can't be avoided. With the more general case of waveforms that occupy bandwidth, the non-linearity will produce harmonics directly in the user's spectrum (as a noise elevation), as well as adjacent to the spectrum that is difficult to filter out due to it's proximity.
The reason for this is best understood from "Two-Tone Third Order Intermodulation Distortion", what this means is if we were to instead present two tones spaced by $\Delta F$ at the input to a device with a 3rd order distortion (produces a 3rd harmonic for a single tone), the non-linearity will produce harmonics that are only $\Delta F$ away from the two tones! This is depicted in the graphic below.
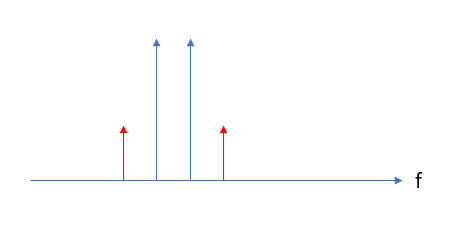
$N$ order distortion products with two tones include all frequencies $mf_1\pm nf_2$ with $m$, $n$ as integers and $m+n=N$. Thus for third order distortion in particular, $N=3$ and we can have $m=2$, $n=1$ or $m=1$, $n=2$. The result shown in the graphic is for $2f_1-f_2$ and $2f_2-f_1$.
Given a non-linearity producing harmonics of significance with a single tone, that same non-linearity will produce intermodulation products on significance when multiple tones are involved - the 2 tone 3rd order intermod products described above will be at a similar level to that of the 3rd harmonic with a single tone- so cannot be arbitrarily insignificant (we can’t have one case without the other when the harmonics are created by a non -linearity).
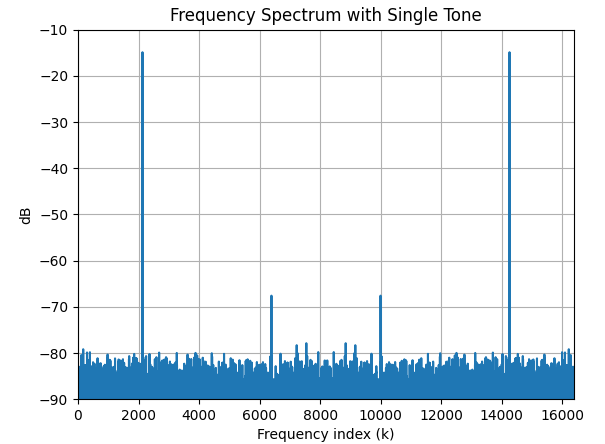
I demonstrate this with a simple example of a 3rd order non-linearity below. In the upper plot is the result of a single tone, where a 3rd harmonic is created by the non-linearity:
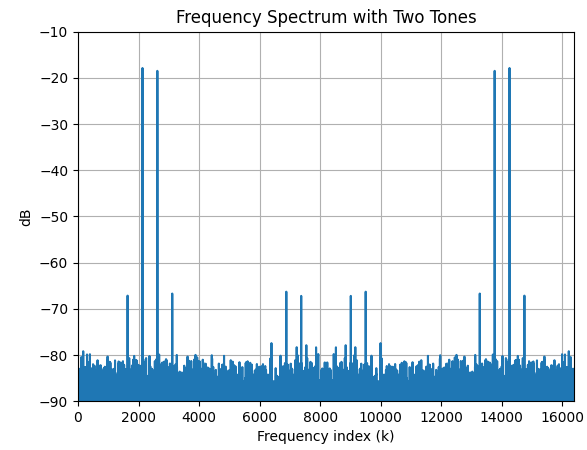
I then repeated this with two tones, each 3dB lower (so that the total power is the same) and we see the intermodulation products I refer to at the same level of the third harmonic:
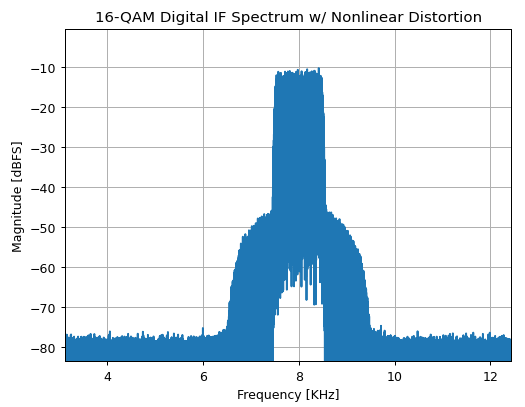
Below shows a more practical example of a 16QAM modulated waveform with 3rd order distortion, where we see "spectral regrowth" on each side of the waveform which is not welcome for over the air transmission (without the distortion this spectrum would be much closer to a rectangular shape), but the entire noise floor within the spectrum is also elevated.
The harmonics can't be avoided, but pre-distortion techniques can be used however to reduce the power in the harmonics. Depending on the source of the harmonic, dithering techniques can also be effective in reducing peak levels of harmonic distortion.

