3
$\begingroup$

It is common knowledge that the duration time samples are collected is inversely proportional to the width of the main lobe in the Fourier domain. The simple example is the rectangular pulse in time whose Fourier transform is the sinc function. The width of the rectangular pulse is inversely proportional to the position of the first zeros of the corresponding sinc function.

As a result, if you desire to decrease the width of the main lobe in the frequency domain, you should take additional samples in the time domain.

I am working on a project wherein I can collect only a certain number of sequential samples, let's say $N$. After I collect $N$ time domain samples, I must wait a certain duration before I can collect another set of $N$ samples. Let's define the number of missing samples in the "gap" as $M > N$. As a result, the time samples might look something like the following: enter image description here
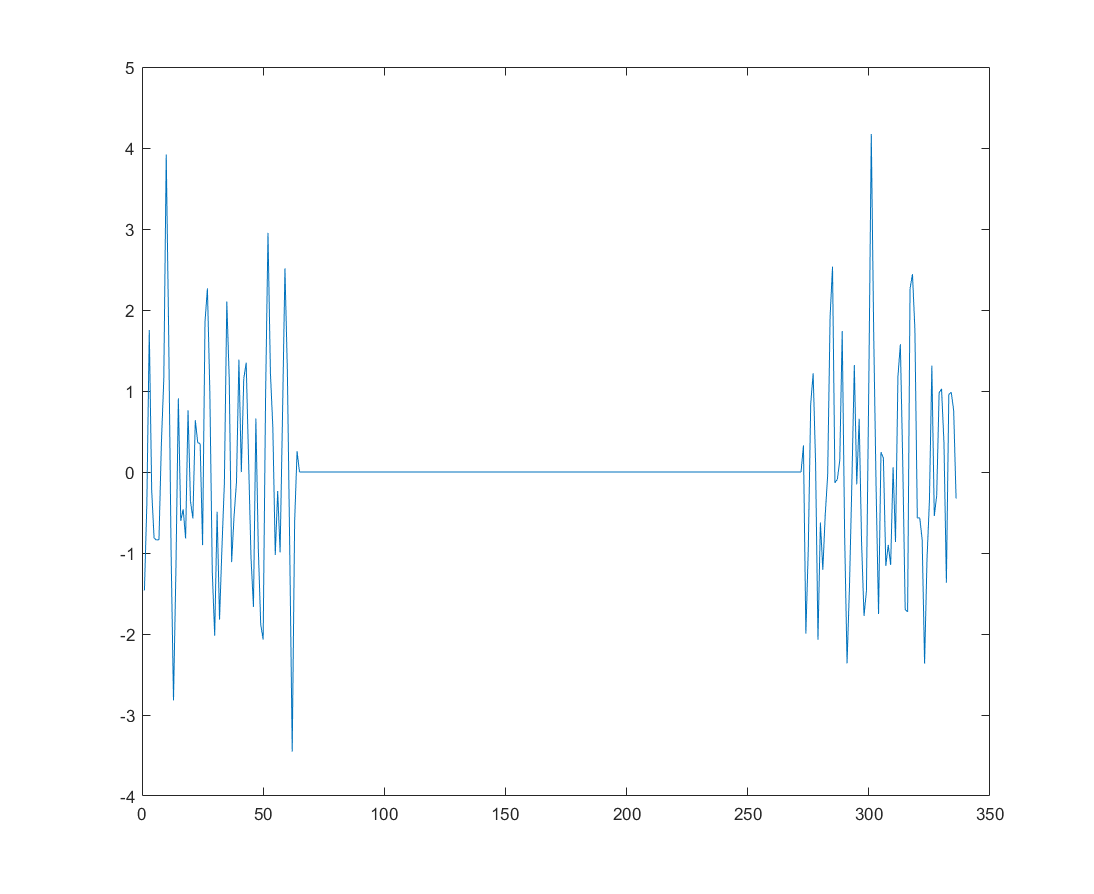
There are 3 scenarios to consider:

  1. "Sample sets": two sets of samples over the time indices $n \in [0, N-1] \cup [M + N, M + N - 1]$
  2. "Aggregated Samples": single sets of samples over the time indices $n \in [0, 2N - 1]$
  3. "Fully Sampled": single sets of samples over the time indices $n \in [0, 2N + M - 1]$

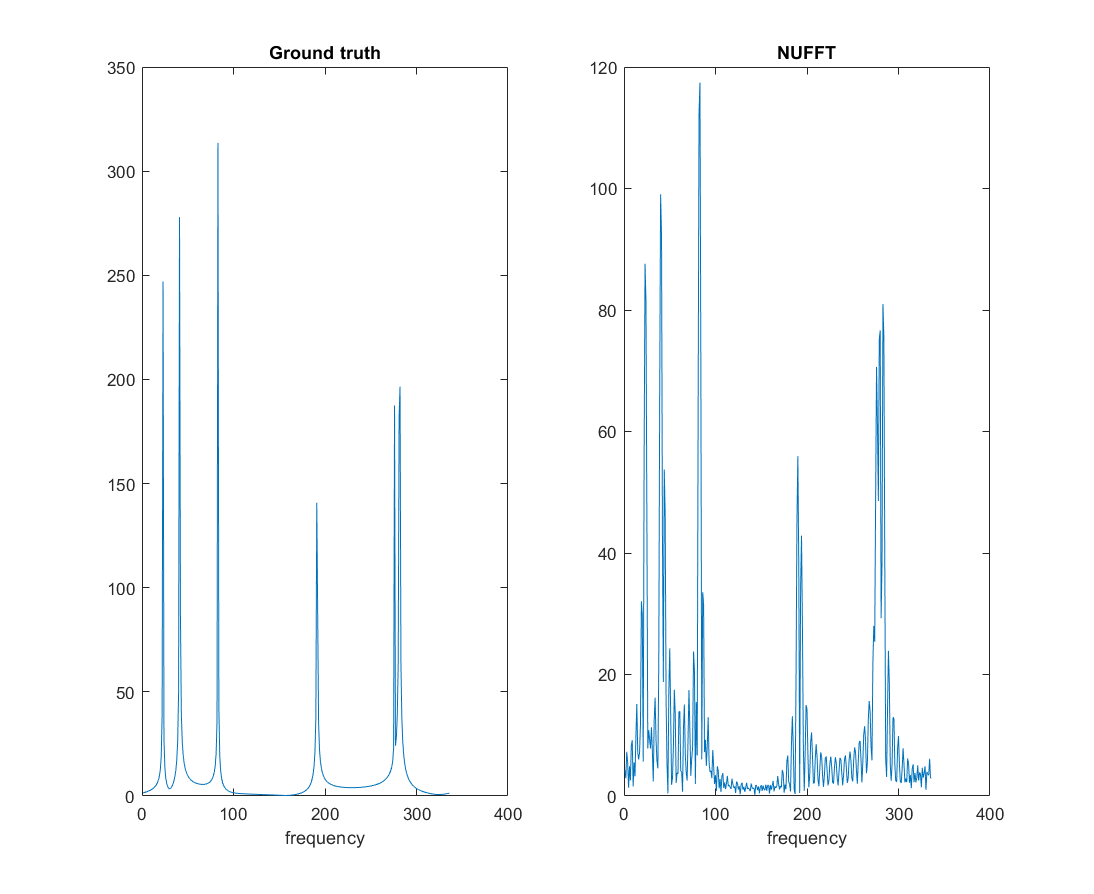
Considering the scenario 1, shown in the first figure, I have collected $2N$ samples but there is a spacing between them. My goal is to recover the Fourier transform of either scenario 2 or 3. In either case, we should see an reduction in the main lobe width in the frequency domain. However, because of the large gap between sample sets in scenario 1, if I use a nonuniform fast Fourier transform (NUFFT computed in MATLAB) or fill the gap with zeros (which is mathematically identical to the NUFFT in this case), the resulting grating lobes dominate the spectrum. Below is a comparison of scenario 3 and scenario 1. As evident in the figure, the frequencies that are closely spaced are considerably distorted due to the finite size as compared with the ideal case. A similar phenomenon can be observed if we were to compare scenarios 2 and 1.

enter image description here

If I were to recover the frequency domain representation of scenario 3, I essentially would be interpolating between the sample sets. If I were to recover the frequency domain representation of scenario 2, I essentially would be moving the second sample set next to the first and resolving the phase difference between the set of samples that would exist at $n \in [N, 2N -1]$ and the set of samples I have which were taken at $n \in [M + N, M + N - 1]$.

Some other notes:

  • The signal I am sampling consists of a sum of sinusoidal signals each of which have different frequencies and are likely to be close to each other in frequency, but the number of different components is typically large $>> N$.
  • For various reasons, I cannot use an autoregressive (AR) method, MUSIC/ESPIRIT/etc. method, Prony's method, or matrix pencil algorithm
  • I have attempted various compressed sensing (CS) methods with limited success as my samples are taken with such a specific structure rather than somewhat randomly spanning the entire time duration as common in many CS problems.
  • I have attempted with some success a fully convolutional neural network approach to learn to fit the NUFFT of scenario 1 to the FFT of scenario 2 or 3.

I would like to get the community's thoughts on the problem and possible solutions. Is there anything I am missing that I could use to solve this problem?

My specific question however is this. I believe the problem appears to be somewhat nonlinear and a data-driven approach may be the best option. In this case, what would be an optimal way to exploit the domain specific knowledge of signal and scenario towards choosing the best deep learning approach? What are some options, preferably in the form of research papers, for taking advantage of the scenario using deep learning? A sparse CNN? A generative model (maybe GAN) for interpolating the gap?

Thanks!

$\endgroup$
4
  • 1
    $\begingroup$ What information are you trying to get from the FFT? Are you estimating the frequency and magnitude of multiple pure sinusoids? I.E. Do you have a priori knowledge of the signal that your doing the FFTs on? $\endgroup$
    – IanJ
    Commented Apr 9, 2021 at 0:35
  • $\begingroup$ Great question.I do not have any priori knowledge on the signal that I am doing the FFT on, aside from knowing it consists of a sum of many sinusoids corrupted by noise. I am actually require the entire spectrum to perform an imaging algorithm after the spectrum is recovered. $\endgroup$ Commented Apr 9, 2021 at 1:17
  • 1
    $\begingroup$ Are you signals phase coherent from one time interval to the next? Elaborating on that, are the signal and system stationary and the blanks are an artifact of your ability to observe? Or does the system although possibly having similar spectral density have a completely random (unpredictable) starting phase and additionally possible random frequency offsets/ drift? This will make a big difference in how you can treat that gap of time. $\endgroup$ Commented Apr 10, 2021 at 11:40
  • $\begingroup$ Your comment is accurate. It will make a big difference. Fortunately, the system does have phase coherence between all samples and does not suffer from frequency drifts. $\endgroup$ Commented Apr 11, 2021 at 3:24

3 Answers 3

1
$\begingroup$

Do you know the exact duration in samples of the sleep time? If so, then you can take the un-windowed fft of the 2nd block of N samples, modify the phase of each bin to “undo” the effect of the sleep time; then you can inverse transform this back into the time domain and concatenate the resulting data with the data from the first frame. Then you can take a single length-2N fft (windowed or not, your choice). This assumes the spectrum of the underlying signal is stationary over the time interval 2N+M. The phase modifications should insure no discontinuity when the 2 frames are concatenated.

$\endgroup$
0
$\begingroup$

Given the phase coherence over non-blanked intervals, a simple and effective approach would be to additionally window the non-blank intervals with a matching window corresponding to the length of the time samples in between blanked intervals. Since the window only tapers the amplitude and does not modify the phase, there will be no issue with different window durations. This will significantly decrease if not eliminate the grating while provide phase coherent processing gain in the DFT from interval to interval over all usable samples. The Kaiser window would be a good window choice for this application. Consider how the DFT for any given frequency bin, as a correlation, de-rotates a signal that may be at that particular frequency such that each sample is aligned in phase, and then the result is summed; our best strategy would be to maximize the information from the samples that are there alone, rather than make our own attempts as to what we think is there to fill in the blanks, to then further convince our assumptions (unless we had other additional external knowledge, in which case such an approach could make sense).

The windowing approach would result with multiple various sized windows over the complete data set corresponding to intervals of non-zero data, and then an FFT would be performed on the entire data set.

To optimize this process further, Sparse FFT algorithms could be employed to take advantage of the gaps in time, but the windowing approach to modify the non-zero time domain data first would be functionally similar.

$\endgroup$
3
  • $\begingroup$ Thanks for this solution. The thought process makes sense. If I am understanding the suggested solution correctly, a window of length M should be applied to each of the non-zero sample groups of size N. Then, compute an FFT over all the samples, including the zero samples. I have attempted this approach and the peaks are not better defined than in the figure in the original post. With the Kaiser window, the difference is negligible. I have tried several other windows without success. Additionally, I had already tried a compressed sensing sparse FFT approach with limited success. $\endgroup$ Commented Apr 15, 2021 at 14:24
  • $\begingroup$ @JosiahSmith the window should match the group; I am not sure what you mean by M and N so if the entire data set is of length N and different groups are of length M1, M2, M3... then the windows would match the groups and likely all be different lengths. Basically keep sharp transitions from occurring $\endgroup$ Commented Apr 15, 2021 at 19:28
  • $\begingroup$ So wherever data suddenly turns off you would force this to be a gradual transition; this should eliminate the sidelobes $\endgroup$ Commented Apr 15, 2021 at 19:30
0
$\begingroup$

If your goal is still to recover the Fourier transform of scenario 3 then I suggest you try the EDFT program, written in Matlab code and available on fileexchange . To calculate the DFT, first replace M missing samples in the "gap" by NaN ('Not a Number' in Matlab) and then run command:

F = edft(your data with NaN);

After this you can also calculate the inverse Fourier transform as:

Y = real(ifft(F));

and ensure that EDFT can fill the "gap" with interpolated data in Y.

You can find more information about the EDFT algorithm at researchgate (31 page article).

$\endgroup$
4
  • 2
    $\begingroup$ Could you please elaborate a bit on the method? As it is, your answer provides a “black-box” solution and it is not clear what this “EDFT” method does. It would be very helpful if you could, at least, briefly explain what the algorithm does and why it is a good solution for the problem at hand. $\endgroup$
    – ZaellixA
    Commented Oct 27, 2023 at 23:11
  • $\begingroup$ EDFT processes the given data in an iterative way starting from DFT where NaNs are replaced by zeros. In this estimate, all frequencies are assumed to have equal weight. In the next iteration, EDFT uses the results of the previous iteration to create frequency-dependent weights. We can also think of this process as reducing the frequency band by dividing it into sub-bands where the given data has significant power and we know from theory that band-limited signals are not time-limited. Thus, bandwidth reduction allows further extrapolation and/or interpolation of the given data. $\endgroup$ Commented Oct 28, 2023 at 10:47
  • $\begingroup$ Since the power plots show the concentration of the spectrum in the bands, then I think that EDFT will be applicable to the given problem. By the way, if we look at the data image and ask - how would the data look in "gap", we could say - we don't know. So why do we assume that zeros are the "best values" we can put in there? $\endgroup$ Commented Oct 28, 2023 at 10:49
  • 1
    $\begingroup$ This information belongs to the answer, not in the comments. I suggest you add that as well as some more information on the actual way the weights are updated in there. The case here is to make your answer more complete, not fill it with comments below it. Anything that can make your answer more complete and easier to understand and verify belongs to the body of the answer. $\endgroup$
    – ZaellixA
    Commented Oct 28, 2023 at 14:36

Your Answer

By clicking “Post Your Answer”, you agree to our terms of service and acknowledge you have read our privacy policy.

Not the answer you're looking for? Browse other questions tagged or ask your own question.