1
$\begingroup$

I'm still learning about signal processing so sorry if this is an intro problem. I want to remove noise from the following data so I can separate each wave and run analysis on it.

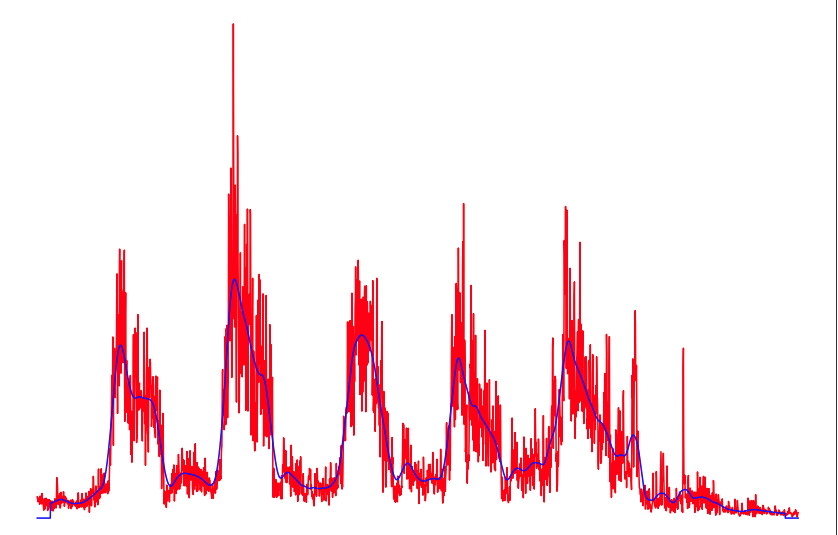
The data is sampled at 41 hz, the red is the raw data and the blue is the data that I applied a lowess filter to with a window size of 41. As you can see it is smoothed to some extent but there is still a lot of peaks and noise in the mix.

I read that you can use RNN or PCA or FFTs to remove noise for bio-signal data, in this case, what are the best techniques to remove noise from the red data so that the blue line is just 5 waves that is easily identifiable?

My ideal result is that after applying the filter I can easily tell that there is 5 waves in this period of data and the resulting index of said waves. Any input is appreciated!

enter image description here

$\endgroup$

3 Answers 3

2
$\begingroup$

If you know the maximum frequency of your signal of interest (for example what is the time duration of the 5 cycles in your plot - then for this time $T$ the max frequency would be $5/T$... could the cycles appear faster? If so whatever the maximum rate is would be pertinent.

With that I would recommend that you design a low pass filter using the least square algorithm (firls in Matlab/ Octave and Python Scipy.Signal). This will usually out-perform any mapped filter from the analog domain (such as Butterworth, Chebyshev, elliptic etc) and provide a linear phase response eliminating any phase distortion in your resulting signal. I generally recommend for most digital filtering applications to not "copy the analog" unless you are modeling such filters specifically, given the capability of these modern direct digital filter design algorithms. You can decide on your cut-off transition band and rejection based on how many taps you want to make your filter, trading off overall delay. (You could also consider the Parks-McLellan algorithm using firpm in Matlab and remez in Octave/Python but I prefer least-squares error criterion over the minimax for most applications).

This would also out-perform a moving average in all but white noise conditions. The frequency response of the moving average approaches a Sinc function as the number of samples averaged increases, with a first null at $1/T$ where $T$ is the time length of the moving average. As a Sinc function it has multiple sidelobes with peaks going down relatively slowly at $1/f$ thus is a poor filter against high frequency components that may be present.

Further if you had a low frequency limit you could consider a bandpass for further noise rejection, but the transient result from doing this may be unacceptable.

$\endgroup$
2
$\begingroup$

As a first appraoch I would suggest to use a mean filter, which will calculate the average of the last n values.

$$y[n] = 1/N \sum_{k=0}^{N-1} x[n-k]$$

If you have access to the full signal (offline processing) you can perform forward and backward filtering which will avoid the delay introduced by a single filter. (Check matlab's filtfilt function for example)

$\endgroup$
2
  • 2
    $\begingroup$ Mean filtering would do the trick but what I've never understood is why do that when you can be precise about it and design a low pass filter with a specific cutoff frequency. Mean filtering is low pass filtering after all and choosing $N$ is just a proxy for a cutoff frequency $\endgroup$
    – Engineer
    Commented Feb 3, 2020 at 20:42
  • $\begingroup$ I agree but without further knowledge of the problem, the mean filter is a simple solution and easy to explain :) $\endgroup$ Commented Feb 3, 2020 at 22:20
1
$\begingroup$

The blue line contains low-frequency data and the actual measured data in the red line has both the low and high-frequency components. In the most simple way, a low pass butterworth filter can be used to remove all the high frequencies in the data. Order of the butter worth filter maybe 3. Even Matlab has an in-built Butterworth filter code. For more information visit the matlab website.

$\endgroup$
2
  • $\begingroup$ To my understanding low-pass butterworth filters are filtering data that is above a certain frequency, but if my data is sampled at a set rate(41Hz), how would that filtering work? And how would I choose the correct cutoff frequency and order? I tried with order 4 and cutoff frequency of 10 then I get ValueError: Digital filter critical frequencies must be 0 < Wn < 1 $\endgroup$
    – ifhasm
    Commented Feb 3, 2020 at 21:23
  • $\begingroup$ please go through the examples mentioned on that webpage properly. mathworks.com/help/signal/ref/butter.html For your case, if cutoff frequency ($f_c$) is 10 Hz, Sampling frequency ($f_s$) 41 Hz, then the $W_n$ would be fc/(fs/2) $\endgroup$ Commented Feb 3, 2020 at 21:50

Your Answer

By clicking “Post Your Answer”, you agree to our terms of service and acknowledge you have read our privacy policy.

Not the answer you're looking for? Browse other questions tagged or ask your own question.