4
$\begingroup$

I'm currently writing a mobile app which needs to analyse musical notes and find the fundamental frequency to determine the pitch. To do this I'm reading in audio data, taking an FFT, taking the auto-correlation of that FFT and then finding the IFFT of that. Having done that I then find the maximum peak (which seems to always be a zero) and then find the next highest peak and determine the lag between them. Finally I calculate the period from this and find the fundamental frequency.

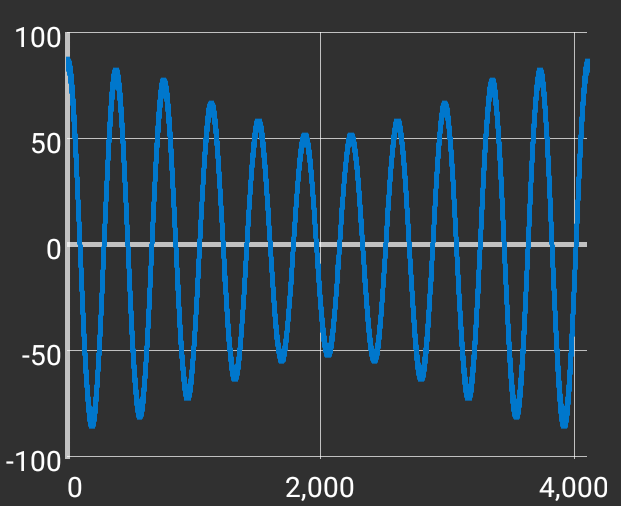
My problem is that this method is almost always returning a value which is half the expected fundamental frequency, only occasionally returning the correct value. Here is a graph of an autocorrelation that returned the correct fundamental frequency value:

enter image description here

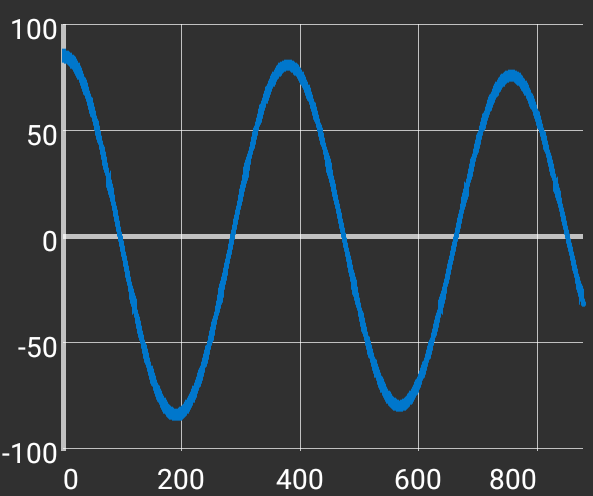
When zoomed in on the relevant part we can see that there's a peak at around 370 which gives for the correct fundamental frequency of 117hz.

enter image description here

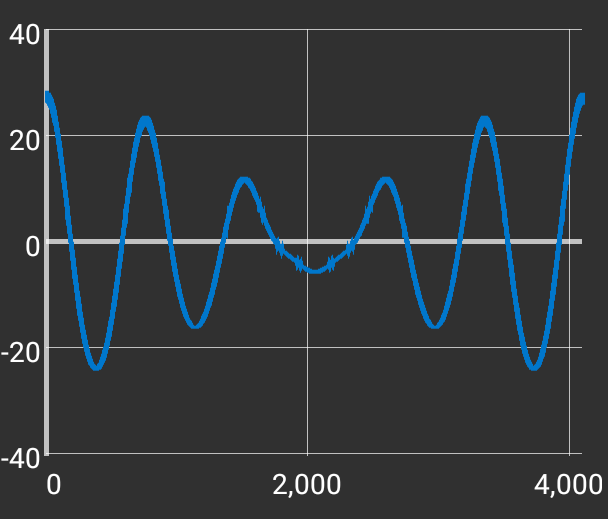
Here's a graph which returned the half the fundamental frequency value:

enter image description here

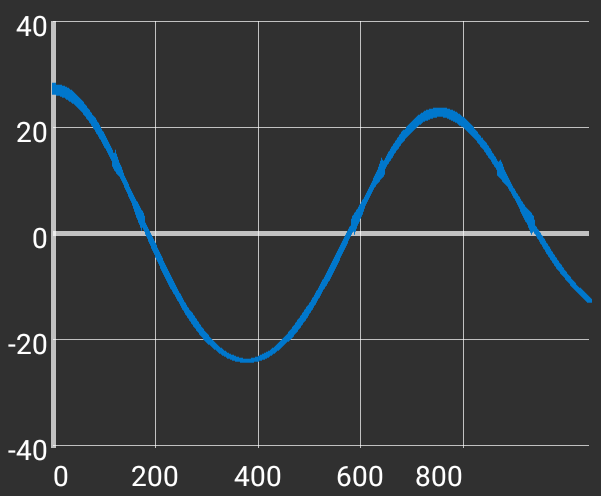
Zooming in on the relevant part we can see there's a trough at around 370 where we'd expect the peak to be:

enter image description here

Does anyone know why this happens and how I can resolve the problem/any other methods I can use?

$\endgroup$

3 Answers 3

2
$\begingroup$

So let's see what you're doing mathematically:

  1. I'm reading in audio data,
  2. taking an FFT,
  3. taking the auto-correlation of that FFT
  4. and then finding the IFFT of that.
  5. Having done that I then find the maximum peak (which seems to always be a zero) and then find the next highest peak and determine the lag between them.
  6. Finally I calculate the period from this and find the fundamental frequency.

I see good intentions!

so, interesting are firstly the steps 2.-4.:

DFT->auto-correlation->IDFT

so, mathematically, thinking in the continuous domain, you're getting

$$r(t)=\mathcal F^{-1}\Big\{\mathcal F\{s(t)\}(f)*\mathcal F\{s(t)\}(-f)\Big\}(t)$$

with $s(t)$ being the signal, and $*$ is the convolution, and $r$ being your autocorrelation inverse transform.

Now, $\mathcal F\{s(t)\}(-f)= \mathcal F\{s(-t)\}(f)$, and convolution in frequency domain is equivalent to multiplication in time domain, so

$$\begin{align} r(t)&=\mathcal F^{-1}\Big\{\mathcal F\{s(t)\cdot s(-t)\}(f)\Big\}(t)\\ &= s(t)\cdot s(-t) \end{align}$$

So assuming your observation (and eventual DFT windows) is time-symmetrical, and in total $N$ samples long , this means that what you get in your result is really just

$$r_{discrete}[n] = s[n]s[N-n]$$ (the continuous convolution gets replaced by cyclic discrete convolution, but that's all)

I'm not quite sure this is what you want – feed in a

$$s(n) =\cos(ft + \varphi) \implies s[n] = \cos(nTf + \varphi)$$

we get

$$\begin{align} r_{discrete}[n] &=s[n]s[N-n]\\ &=\cos(nTf + \varphi)\cos((N-n)Tf + \varphi)\\ &=\frac12\cos\Big(nTf+\varphi + (N-n)Tf + \varphi\Big) \\ &\,+\,\frac12\cos\Big(nTf+\varphi - \big( (N-n)Tf + \varphi\big)\Big)\\ &=\frac12\cos\Big((n+N-n)Tf + 2\varphi\Big) \\ &\,+\,\frac12\cos\Big((n-N+n)Tf \big)\Big)\\ &=\underbrace{\frac12\cos\Big(NTf + 2\varphi\Big)}_{\text{const.}\implies\text{"strongest peak at 0"}} +\underbrace{\frac12\cos\Big((2n-N)Tf \big)\Big)}_{\text{double frequency because} 2n}\\ \end{align}$$

Your method hence doesn't have any advantage over just directly finding the distance of two peaks in the square of your original signal; for multiple added sines, you get a lot of intermodulation products.

Hence: You can either directly do the autocorrelation in time domain (ie. on the original signal $s$), or find the peaks of the magnitude of the DFT. Your method seems to be well-intended, but confused.

$\endgroup$
6
  • $\begingroup$ Thanks for the help. How exactly do you perform autocorrelation in the time domain? The code I'm currently using multiplies the square of the real and imaginary parts together but obviously that's not going to work if I don't take an FFT first. $\endgroup$
    – PyroPez
    Commented Aug 19, 2016 at 18:20
  • $\begingroup$ you don't need to use the FFT to do autocorrelation; just convolve with the time-inverse; see wikipedia on autocorrelation. $\endgroup$ Commented Aug 19, 2016 at 18:26
  • $\begingroup$ you can implement an autocorrelation that is faster than the time-domain implementation, but that is a multiplication in frequency domain, not a autocorrelation in frequency domain. $\endgroup$ Commented Aug 19, 2016 at 18:26
  • $\begingroup$ Sorry to ask so many questions (I'm not too knowledgeable when it comes to Signal Processing in case it wasn't obvious) but I can't seem to find anything on Google about time-inverse. Is it just reversing the signal? $\endgroup$
    – PyroPez
    Commented Aug 19, 2016 at 18:38
  • $\begingroup$ @PyroPez yes, it is! $\endgroup$ Commented Aug 19, 2016 at 20:03
2
$\begingroup$

...analyse musical notes and find the fundamental frequency to determine the pitch.

So, measure 440 Hz and output "A" (?), a tuner application.

To do this I'm reading in audio data, taking an FFT, taking the auto-correlation of that FFT and then finding the IFFT of that. Having done that I then find the maximum peak (which seems to always be a zero) and then find the next highest peak and determine the lag between them. Finally I calculate the period from this and find the fundamental frequency.

This sounds like the superposition of two methods and two domains.

In the above process, once you obtain the FFT, you "transit" from the time domain to the frequency domain. In this domain, your signal is expressed as a sum of sinusoids at different frequencies.

Therefore, all you have to do (in this frequency domain) is locate the highest peak sinusoid.

This might be very easy if you are recording an electric instrument (bass, guitar, other) over wire or very challenging, if you are recording an instrument over the standard microphone found on a mobile phone.

BUT!, instead of using the FFT first, you could obtain the autocorrelation of the signal and then examine if that autocorrelation is periodic. The added benefit of this is robustness to noise.

Assuming that a dominant sinusoid exists in a recording, measuring the distance between the first and second peaks of the recording's autocorrelation would give an estimate of the period of the sinusoid. This technique applies to the time domain.

Because of the noise aspect, you might have to use a combination of the two. So, for example, record a signal, take its autocorrelation then apply FFT to the autocorrelation to discover its periodicity. In parallel to this, you might want to estimate spectral flatness as a measure of quality because it might be that the signal at the input does not contain any periodic component.

Finally, please note that due to the way discrete autocorrelation works, the autocorrelation of some signal $x(n)$ composed of $N$ samples, will have a length of $2 \times N - 1$ samples...which would need to be taken into account when trying to derive timings and frequencies from it.

Now, this is as far as what is mentioned in the question is concerned. In general, there are various techniques to perform pitch detection ranging from the very simple to rather complex ones. For a brief overview, please see this link, this link and this link, while, for something more specific, please see this link and this link

Hope this helps.

$\endgroup$
1
$\begingroup$

Pitch Detection and Octave Determination can be very tricky. Are you working on a polyphonic signal? If so, you need to forget about auto-correlation and consider a frequency-domain method.

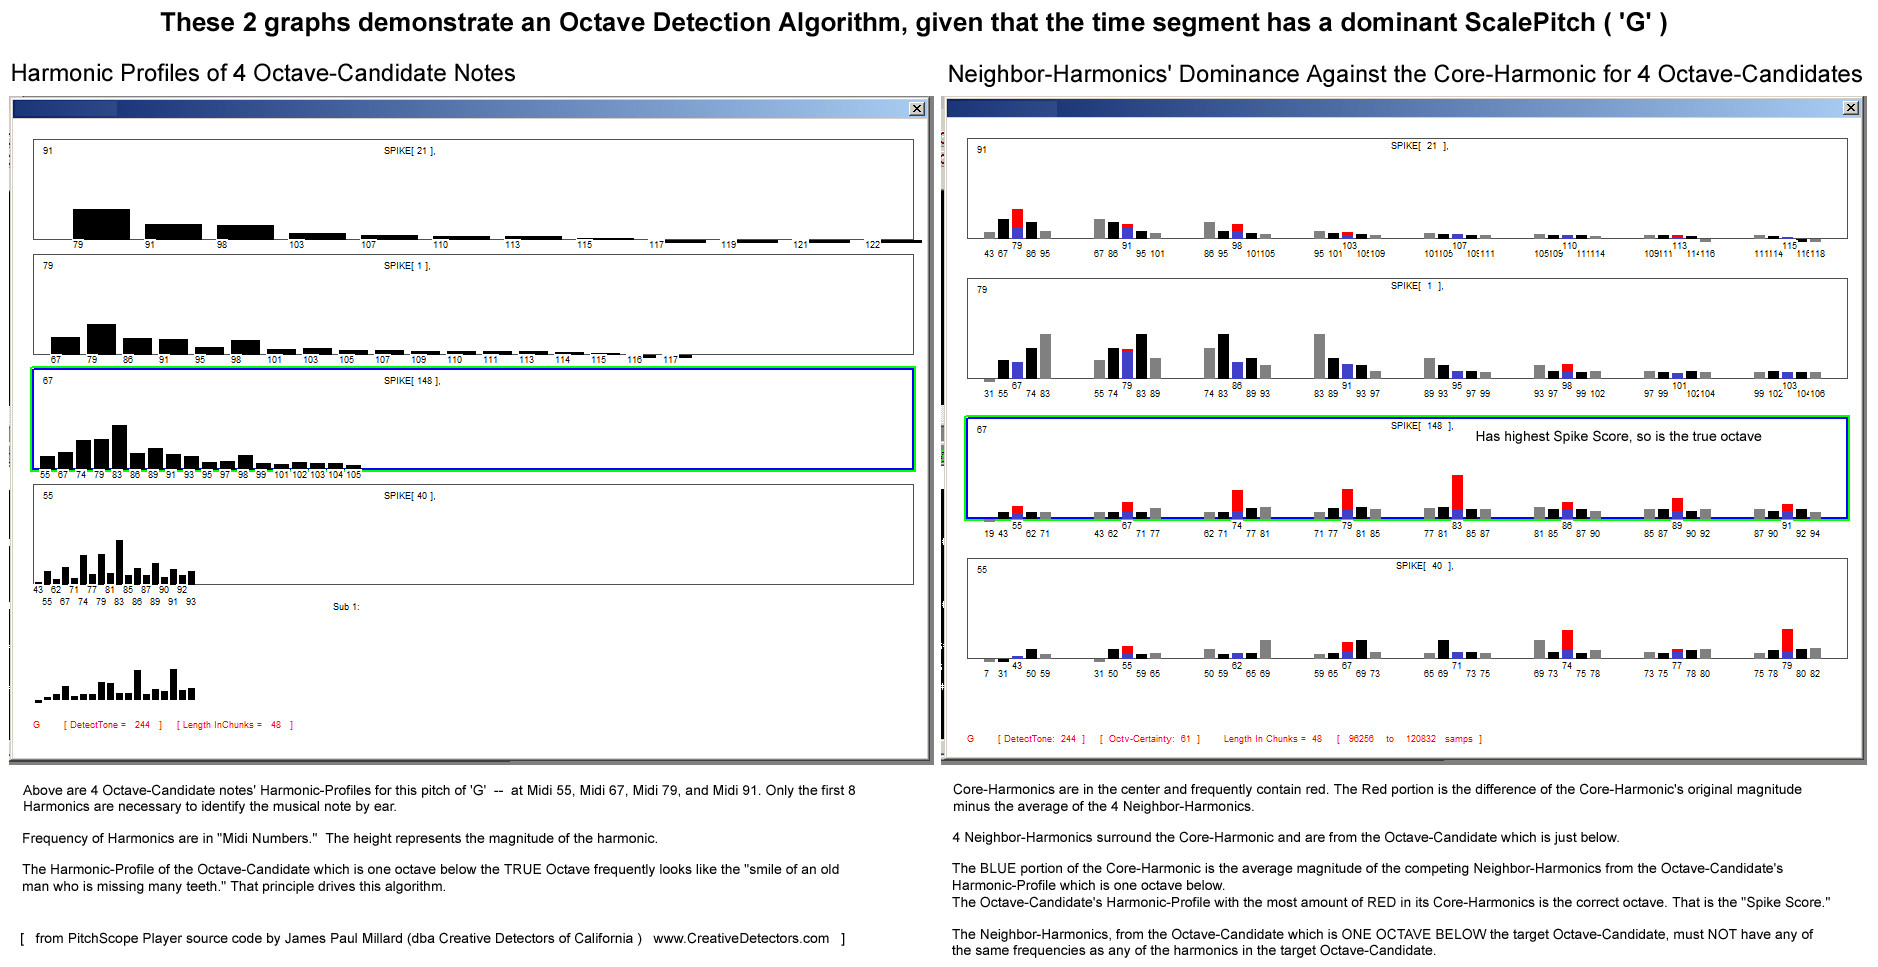
I created an application, PitchScope Player, which can do pitch detection upon MP3 files in realtime and its complete source code is posted on GitHub (source code is on GitHub below). I chose to use a 2 Stage Algorithm for Pitch Detection that works like this: a) First the ScalePitch of a note is detected -- 'ScalePitch' has 12 possible pitch values: { E, F, F#, G, G#, A, A#, B, C, C#, D, D# }. And after ScalePitch and Time-Width of a note is determined, b) then the Octave (fundamental) of that note is calculated by examining ALL the harmonics of 4 possible Octave-Candidate notes.

Octave Detection can also be tricky, especially on a polyphonic signal where the fundamental harmonic and/or other harmonics are missing. But my algorithm will work, even if some harmonics are missing. The diagram below also gives a rough idea how to calculate the Octave from the detected harmonics of the note.

https://github.com/CreativeDetectors/PitchScope_Player

https://en.wikipedia.org/wiki/Transcription_(music)#Pitch_detection

The diagram below demonstrates the Octave Detection algorithm which I developed to pick the correct Octave-Candidate note (that is, the correct Fundamental), once the ScalePitch for that note has been determined. Those wishing to see that method in C++ should go to the Calc_Best_Octave_Candidate() function inside the file called FundCandidCalcer.cpp, which is contained in my source code at GitHub.

enter image description here

$\endgroup$

Your Answer

By clicking “Post Your Answer”, you agree to our terms of service and acknowledge you have read our privacy policy.

Not the answer you're looking for? Browse other questions tagged or ask your own question.