2
$\begingroup$

I have a noisy signal in I/Q format with a peak frequency that constantly changes between 0.5Hz and 4Hz. The sample rate is 64Hz. I want an output showing the current peak frequency with a maximum lag of about 1 second.

This is my first attempt to solve this problem with FFT, and the question is: What is required to make the frequency estimate accuracy around 0.01 Hz?

The idea is to use the FFT to both do the filtering of unwanted higher frequency noise and do the estimation of the 0.5-4Hz signal peak frequency.

With one second, we have 64 complex samples go into the FFT and 64 complex magnitudes coming out. They will then represent frequencies from -32Hz to +31Hz. We look at the 6 bins representing 0Hz to 6Hz and want to interpolate here to find the peak.

The algorithm must run on a low power CPU, so computational power is quite limited and power consumption is an important parameter.

The algorithm looks like this in Scilab:

sample_rate = 64;
secs = 1;
nr = sample_rate * secs;

f_signal = 0.45; // Hz - The signals peak frequency

// Construct the ideal complex signal vector 
BT = complex( cos(f_signal*2*%pi*((1:nr)-1)/nr) , sin(f_signal*2*%pi*((1:nr)-1)/nr) );

// Remove any DC offset (or not?)   
// BTavg = sum(BT) / nr;
// BT = BT - BTavg;

// Make a time domain plot
figure(1);
clf();
plot(real(BT), 'red');     
plot(imag(BT), 'blue'); 

// Perform FFT (and shift bins around to have -32Hz to +31Hz)
BF = fftshift(fft(BT));

// Create the associated frequency vector f(1) = frequency of bin 1    
f = sample_rate * (-(nr)/2:(nr-2)/2)/nr;

// Make a frequency domain plot
figure(2);
clf();
plot(f(1:nr), abs(BF(1:nr)), 'blue')

// Find max peak in the first 6 bins        
pmax = 0;
imax = 0;
for i=(33:38)
    p = abs(BF(i));
    printf("i = %d f = %f p = %f \n", i, f(i), p);
    if p > pmax then
        pmax = p;
        imax = i;
    end
end

// Interpolate to find better estimate of peak frequency
y1 = abs(BF(imax-1));
y2 = abs(BF(imax));
y3 = abs(BF(imax+1));
// d = (y3 - y1) / (2 * (2 * y2 - y1 - y3)); // Quadradic method
d = (y3 - y1) / (y1 + y2 + y3); // Barycentric method
fmax = f(imax) + d * (f(imax+1) - f(imax));

printf("Estimated = %.2f Hz Actual = %.2f Hz Error = %.2f Hz\n", fmax, f_signal, abs(fmax-f_signal));

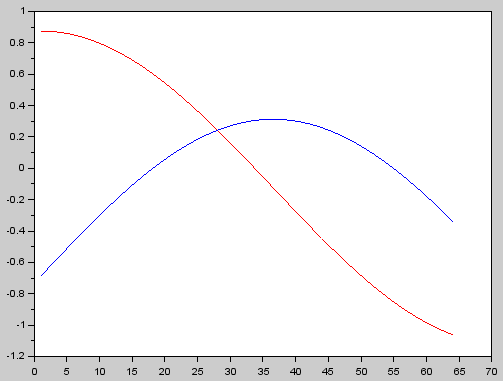
The input plot looks like this:

Input to the FFT

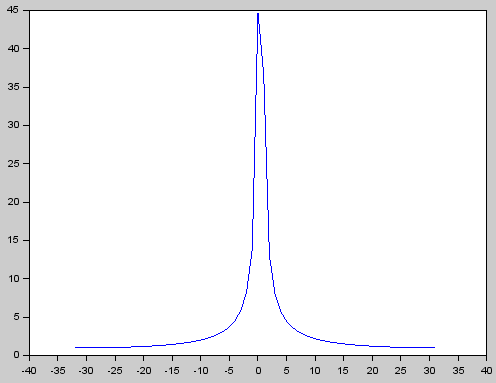
The output from the FFT (shifted) looks like this:

Output from FFT

The console output showing the power from the 6 bins as well as the final estimated frequency and error is here:

  i = 33 f = 0.000000 p = 44.717018 
  i = 34 f = 1.000000 p = 36.588120 
  i = 35 f = 2.000000 p = 12.993838 
  i = 36 f = 3.000000 p = 7.911240 
  i = 37 f = 4.000000 p = 5.696681 
  i = 38 f = 5.000000 p = 4.459184 
  Estimated = 0.24 Hz Actual = 0.45 Hz Error = 0.21 Hz

As can be seen the error is way bigger than desired for this specific test frequency of 0.45 Hz. By changing the frequency it's clear that the error near zero only for near integer frequencies.

A caveat is that the input signal also has a varying DC offset, so ideally the DC offset should be "filtered" as well.

I am sure there are ways of saving power by only calculating the 6 bins we are interested in, but that optimization only makes sense if we can get the required accuracy from the algorithm in the first place.

So again: What is required to make the error on the estimates more like 0.01 Hz?

$\endgroup$

3 Answers 3

3
$\begingroup$

FFTs don't work well for sinusoidal frequency estimation if there is a nearby strong interfering signal. Normally one needs at least 2 FFT result bins of separation to just start to resolve 2 frequency peaks. For frequencies around or lower than FFT result bin +-2, any significant DC offset will constitute that strong nearby interference (in bin 0) preventing resolving either frequency as an independent peak.

My guess is that, if the S/N ratio is low enough, a parametric estimator will produce a more accurate estimation, given that you have more samples than unknowns (3 sinusoidal parameters + 1 DC offset parameter).

Another possibility is to try to remove the DC offset by averaging or low pass filtering over a much longer window of samples, perhaps several hundred to thousands.

Added: Strictly real valued sinusoids very near DC (or Fs/2) will also see interference from their own conjugate images in the spectrum. Any input gain imbalance in the 2 quadrature components for a complex sinusoidal signal will contain some of that same conjugate interference as well.

$\endgroup$
4
  • $\begingroup$ Thanks. There is also a significant error if I change the frequency to say 3.4 Hz... Is there an (other) error? $\endgroup$ Commented Mar 12, 2015 at 11:19
  • $\begingroup$ The adjacent peak interference rolls off at the rate of a Sinc function envelope. $\endgroup$
    – hotpaw2
    Commented Mar 12, 2015 at 11:23
  • $\begingroup$ Setting f_signal = 0.45 Hz or 3.45 Hz both gives a frequency error of 0.21 Hz. Is that consistent with your idea that the adjacent peak (DC) interference rolls off as per a Sinc function? Or is there some other error? $\endgroup$ Commented Mar 12, 2015 at 15:46
  • $\begingroup$ A barycentric or parabolic peak estimator is sub-optimal, especially given only the magnitude of an un-windowed signal. Try Sinc interpolation with successive approximation. $\endgroup$
    – hotpaw2
    Commented Mar 12, 2015 at 17:20
2
$\begingroup$

You could use the Gaussian ratio technique for frequency estimation:

http://fftguru.com/fftguru.com.tutorial4.pdf

and associated C++ code

But your low frequency creates a problem. As noted in the classic 1978 windows paper by Harris (http://web.mit.edu/xiphmont/Public/windows.pdf), nearby negative frequencies can add constructively/destructively with positive frequencies. Thus, it's important not to operate too closely to either the 0 or N/2 frequency bins - and with inputs from .45 to 4 Hz, you are definitely doing that.

So the first thing to do is to modulate your input up to say, 20 Hz or so. Since I don't usually work on comms stuff on a day to day basis, I dusted off one of my old comms books and read up about ssb. As you only have a single input sinusoid (with an additional 90 degree shifted version), this made things a bit easier.

The following C++ code demonstrates the process: 1) generate cos/sin sinusoids of a specific frequency (note that I include pi in the time parameter below - when generating signals containing multiple sinusoids, it's easier to type pi in only once) - phi is an arbitrary phase variable that can be changed; 2) ssb modulate the signals up to 20 Hz using the phasing method - the addition operation chooses the upper sideband, and you get a real signal as a result - ssb gets things away from the 0 frequency bin; 3) compute the Gaussian window; 4) multiply the data record by the window; 5) compute FFT and print out results; 6) compute frequency and amplitude estimates.

    // *****************************************************************************************
// ssb_freq_est - 1) generate a sinusoidal signal between .45 Hz and 4 Hz, 2) bandshift up
// by 20 Hz and obtain upper sideband by ssb, 3) multiply data record by a Gaussian window,
// 3) take fft, 4) locate the highest amplitude squared output(s), 5) compute the frequency
// of the tone,           written by Kevin J. McGee at fftguru.com
#include <cstdio>           //
#include <cstdlib>          //
#include <iostream>         //
#include <cmath>            //
using namespace std;        //
void fft_recur(long, double* r, double* i);
int main (int nNumberofArgs, char* pszArgs[ ] ) {
const long N = 64;
double sample_rate = 64., r[N] = {0.}, i[N] = {0.}, s[N] = {0.}, w[N] = {0.} ;

long n ;    double  phi = 0., alpha = 6., t, twopi = 6.2831853071795865;
double fbin = 0., amp = 0., c;

for (n = 0; n < N; n++)  {  // generate input data
    t = twopi*n/sample_rate;
    r[n] = 10.*cos(1.5*t + phi) ;
    i[n] = 10.*sin(1.5*t + phi) ;
} // end for

// create ssb - upper sideband
for (n = 0; n < N; n++)  {  // modulate up to 20 Hz
    t = twopi*n/sample_rate;
    r[n] = r[n]*sin(20.*t) ;
    i[n] = i[n]*cos(20.*t) ;
    r[n] = r[n] + i[n];    // + chooses upper sideband
} // end for

//Gaussian window computed using HARRIS 78 windows paper
for (n = -N/2; n < N/2; n++) {
    w[n + N/2] = exp(-2.*(n*alpha/N)*(n*alpha/N)) ;
} // end for

// multiply data record by Gaussian window
for (n = 0; n < N; n++) {
    r[n] = w[n]*r[n] ;
    i[n] = 0. ;
}

fft_recur(N, r, i);

for (n = 0; n < N/2 + 1; n++) {
    r[n] = r[n]*r[n] + i[n]*i[n] ;   // compute magnitude squared
    printf("%2d\t%9.7f\n",n,r[n]);
}
cout << "\n\n\n";

// compute frequency and amplitude
// in code below, c is a parameter related to the Gaussian window beamwidth
// - fbin is a fractional bin number (ie: if input sinusoid is at 23.5 Hz, then fbin should
// compute to be 23.5 - actual frequency is then fbin*sample_rate/N )
for (n = 16; n < 26; n++) {             // compute for bins 16 to 25
    c = 8.*(alpha/twopi)*(alpha/twopi);
    fbin = n +.5 +.5*c*(.5*log(r[n + 1]) - .5*log(r[n]));
    amp = sqrt(c)*exp(.5*log(r[n]) + ((fbin-n)*(fbin-n))/c)*(2.0*sqrt(twopi/2.)/N) ;
    printf("%2d\t%9.7f\t%9.7f\n",n,fbin*sample_rate/N,amp);
}
system ("PAUSE");
return 0;
} // end main

//******************** fft_recur ***********************
void fft_recur(long N, double *r, double *i)  {
long h, i1, j = 0, k, i2 = N/2, l1, l2 = 1;
double c = -1.0, s = 0.0, t1, t2, u1, u2;

for (h = 0; h < N-2; h++) {    // ***** bit reverse starts here ***
    if (h < j) {
       t1 = r[h]; r[h] = r[j]; r[j] = t1; 
       t2 = i[h]; i[h] = i[j]; i[j] = t2;
    }
    k = i2;
    while (k <= j) {
          j = j - k;      k = k/2;
    }
    j = j + k;
}   //****** bit reverse done ******

for (k = 1; k < N; k = k*2) {
    l1 = l2;     l2 = l2*2;
    u1 = 1.0;    u2 = 0.0;
    for (j = 0; j < l1; j++) {
        for (h = j; h < N; h = h + l2) {
            i1 = h + l1;
            t2 = (r[i1] - i[i1])*u2 ;
            t1 = t2 + r[i1]*(u1 - u2) ;
            t2 = t2 + i[i1]*(u1 + u2) ;
            r[i1] = r[h] - t1;
            i[i1] = i[h] - t2;
            r[h]  = r[h] + t1;
            i[h]  = i[h] + t2;              
        } // end for over h
        t1 = u1 * c - u2 * s;
        u2 = u1 * s + u2 * c;
        u1 = t1;  //x = u1 - u2;    y = u1 + u2;
    } // end for over j
    s = - sqrt((1.0 - c) / 2.0);
    c =   sqrt((1.0 + c) / 2.0);
} // end for over k

} // end fft  *******************************************************

With an input of 1.5 Hz, and ssb'd by 20 Hz, the program computes the following fft output (bins 10 to 30):

10      0.0000000
11      0.0000000
12      0.0000001
13      0.0000112
14      0.0008969
15      0.0416534
16      1.1179498
17      17.3406472
18      155.4460465
19      805.3144096
20      2411.1413024
21      4172.0668447
22      4172.0668527
23      2411.1412963
24      805.3144131
25      155.4460450
26      17.3406477
27      1.1179496
28      0.0416535
29      0.0008969
30      0.0000112

You can see that the output shows something equidistant between bins 21 and 22, which is where it should be for a 1.5 Hz/20 Hz ssb signal. The frequency/amplitude calculation results in (bins 16 to 25):

16      21.5000001      10.0000015
17      21.5000000      9.9999998
18      21.5000000      10.0000000
19      21.5000000      10.0000000
20      21.5000000      10.0000000
21      21.5000000      10.0000000
22      21.5000000      10.0000000
23      21.5000000      9.9999999
24      21.5000000      10.0000002
25      21.5000001      9.9999991

Since the peak(s) in the previously shown FFT output were at bins 21 and 22, the frequency/amplitude calculation of bin 21 above is the one to use (the bin 21 output used bins 21 and 22 in the calculation). As you can see, it's quite accurate, as you would expect from a good algorithm and zero input noise.

The above code was not at all optimized - there are a lot of efficiencies that could be done (eg: use LUTs instead of sin/cos functions, pre-compute some variables, etc). And depending on the amount of noise you have, things may not be optimal for your problem (ie: you may need to use more points in the data record to meet your accuracy requirements, or ssb bandshift differently, or shift to a different part of the spectrum, or choose a different Gaussian beamwidth, or replace the FFT with a faster, more accurate one, etc.

But I've already spent too much time on the above code, and I don't know what kind of problems you may encounter.

EDIT: Corrected the stated bin numbers (22 changed to 21). Also, run the code with very low frequencies (eg: .0000001), and you'll see just how good this technique can be.
$\endgroup$
6
  • $\begingroup$ Thanks for the extensive work put into the answer. I follow you 100% and will try this method to see how it performs (also with noise). $\endgroup$ Commented Mar 16, 2015 at 6:31
  • $\begingroup$ This is a very good algorithm. Thanks again. I am surprised that the alpha needs to be so big as it really masks out a lot of the signal. You should get a lot more up-votes for this answer :-) It does however not seem to deal well with the situation where each second of the input signal has a new DC offset. Any ideas on this? $\endgroup$ Commented Mar 19, 2015 at 12:59
  • $\begingroup$ There are 3 main variables: 1) sample rate, 2) Gaussian beamwidth, and FFT size, and they all interact, so there's a bit of an art to picking optimal numbers. For a single isolated sinusoid (not near the 0 or N/2 points), a larger alpha works well. As for the DC offset - if it's changing over time, then you might be picking up a little smearing due to the fact that your input is not stationary. You could try a narrower beamwidth, or baseband further up the spectrum, or increase the sample rate (with corresponding increase in FFT size if you want to keep your overall time the same). $\endgroup$
    – user14819
    Commented Mar 20, 2015 at 3:15
  • $\begingroup$ I never really understood the point in mixing with the carrier. The "mirror-peak" at negative frequencies just moves along with the carrier. So that peak ends up falling in bins that are just as closely spaced as before the mixing. What was the intention? $\endgroup$ Commented Apr 26, 2015 at 14:00
  • $\begingroup$ @Rolf Multiplying with the carrier shifts the signal up in frequency and gets it away from the DC point. The Gaussian technique has difficulty working with signals close to DC, due to the mirror negative frequency adding constructively/destructively to the positive side (as noted in the well known Harris windows paper). And yes, the closely based mirror peak at negative frequency moves up with the positive one. That's where single-sideband processing comes in. Depending on how it's done, either the lower or upper sideband is selected, and one of those close-by peaks will be eliminated. $\endgroup$
    – user14819
    Commented Apr 26, 2015 at 22:32
0
$\begingroup$

If your signal is quite similar to sinus with noise, then I think you can estimate frequency by using fitting or regression methods. Search Internet with keywords: "fit", "regression", "least square" and "sine". You can find a lot of program code, tools and so on. For example (I do not try it) - sine-function-fit See also good discussion in StackExchange "Given a data set, how do you do a sinusoidal regression on paper? What are the equations, algorithms?" There are a lot of good books and manuals for fitting/regression. I can recommend classical book Numerical Recipes. See chapter "Modeling of Data". Especially "Fitting Data to a Straight Line" for base understanding and "Nonlinear Models" for understanding method of solution your problem. It is possible that there are specific methods for sine function.

Implementation of regression in your case can be effective. You must solve minimization problem for system by size of 3 (for amplitude, frequency and phase). Calculation of coefficients of this system is sums of some functions from all your points - O(N).

$\endgroup$
2
  • $\begingroup$ Would regression/fitting typically be the least computationally intensive (lowest power consumption) method for that type of problem? $\endgroup$ Commented Mar 12, 2015 at 15:41
  • $\begingroup$ @RolfOstergaard I update my answer $\endgroup$
    – SergV
    Commented Mar 13, 2015 at 3:29

Your Answer

By clicking “Post Your Answer”, you agree to our terms of service and acknowledge you have read our privacy policy.

Not the answer you're looking for? Browse other questions tagged or ask your own question.