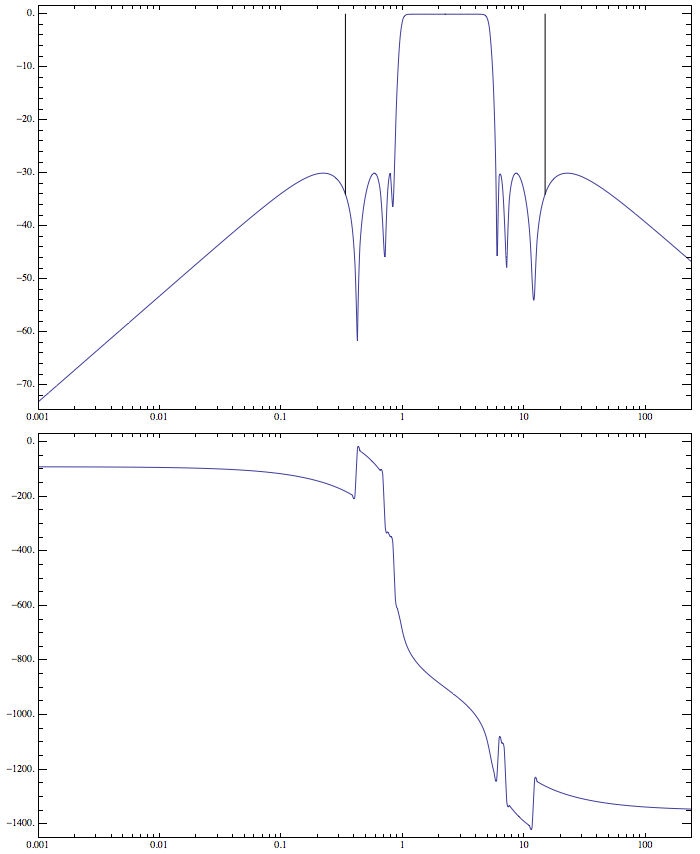
Even though you might have designed your filter to be stable, Stability Margin is a concept which is used to estimate how far we are away from becoming Marginally stable/unstable both in terms of Gain and Phase.
This would mean then at Unity Gain(0 dB) any phase rotation of -180 degrees or ODD multiples of it is bound to make your system unstable and thus comes Phase Margin, the amount of rotation on the Pole Zero plot which would bring the Root Locus plot to intersect the point -1(or rather how far you're away from the 180 degree line on a Bode Plot when your Gain Magnitude is Unity).
Likewise we can state the same in terms of Gain. The amount of Gain that'd be necessary for the same Nyquist plot to expand and hit the point -1 (or how far you're away from the Unity magnitude gain when the phase response is -180 degrees).
Practical consequences of system implementation always require you to have some Margin because you're never guaranteed that the Gain and the Phase plots are exactly replicated when the system is actually working. So these parameters will tell you if you're safe or not. Theoretically, even being away from 1 degree away from -180 Degree line at Unity gain is stable; but practically there are things that can happen which will push it away easily.
You can learn a lot about these at
- :http://en.wikipedia.org/wiki/Phase_margin
- http://www.facstaff.bucknell.edu/mastascu/econtrolhtml/Freq/Nyquist4.html (a good simulation is shown here).
Stability Margin doesn't have any impact on the Stability of the Filter, it'll just indicate if your filter is Stable or not.
The Phase plot is actually shown in Degrees. Your filter looks like it is Marginally stable because at a few multiples of -180 degrees, the Gain is 0dB(oscillatory), and that too within the frequencies you've designed the filter to operate, it looks not promising at all. The Black Lines on the gain plot should appear at every multiples of -180 degrees. Also coming to the phase plot, there are no Black lines in this case because at least one Unity Gain crossover point has a Phase rotation that is an Integral odd multiple of -180 Degrees.

