1
$\begingroup$

Imagine I have a perfect 1 Hz continuous signal that I sample at 100ms intervals for one second (this gives me 10 samples in total) If I perform a DFT on this and only look at the positive frequencies, that would give me 5 frequency bins whose widths are 1Hz each. Yielding:

  • Bin 1 -> [0Hz - 1Hz]
  • Bin 2 -> [1Hz - 2Hz]
  • Bin 3 -> [2Hz - 3Hz]
  • Bin 4 -> [3Hz - 4Hz]
  • Bin 5 -> [4Hz - 5Hz]

So my question: What is the effect of my 1Hz continuous signal now falling into both frequency Bin 1 and Bin 2? Would the magnitude for example simply get cut in half and be assign to both bins equally?

Also, I assume spectral leakage due to windowing may be a concern. But in general, is my assumption correct that frequency that fall onto bin edges get equally distributed into each bin?

$\endgroup$
5
  • $\begingroup$ Look up "scalloping loss" in the context of the DFT. $\endgroup$
    – Envidia
    Commented Oct 9 at 13:51
  • $\begingroup$ When interpreting the DFT, one can interpret each output X[k] as the cross correlation of the input time signal with a complex sinusoid at frequency k/N (physical frequency in hertz will be fs*k/N). Each DFT "bin" will be the value of that cross correlation (the "bin" is in quotations because I don't think that it is correct to interpret it as some averaged energy in the "bin"). $\endgroup$
    – o.c.
    Commented Oct 9 at 14:45
  • 1
    $\begingroup$ Are you looking for a mathematical analysis? Otherwise, why don’t you just simulate it and see what you get! $\endgroup$
    – Jdip
    Commented Oct 9 at 14:51
  • $\begingroup$ To answer your question directly, your fs=10Hz, N=1 so you're cross correlating your signal with DC (0*1/10), complex exponential of frequency 10*1/10=1hz, etc.. so your input signal doesn't "fall in between bins" but rather exactly on one of the frequencies you're cross-correlating with, hence you'll get a value of 1 $\endgroup$
    – o.c.
    Commented Oct 9 at 14:55
  • $\begingroup$ Does this help you? dsp.stackexchange.com/a/83002/21048 $\endgroup$ Commented Oct 9 at 16:16

3 Answers 3

1
$\begingroup$

The DFT can be functionally explained as a "bank of filters" in that each bin of the DFT is the result of a bandpass filter centered on that bin. Without further windowing, this filter has a frequency response given by the "Dirichlet Kernel" which resembles a Sinc function in that the attenuation for distant frequencies off of the center goes down relatively slowly. Notably however, the response will be a null at every other bin location, which is the reason if an input frequency was exactly on bin center, it would not appear in any other bin. However if the input was exactly mid-way between bins, then the response from every other bin would be non-zero, which means that tone would appear in every other DFT bin! This is improved through the use of windowing, at the expense of increasing the width of the primary bandpass shape for any given bin (thus a reduction in frequency resolution).

Below shows a graphic of what would occur if we had a single frequency (note that a "single frequency" is given here by $e^{j\omega_1 t}$, not $\cos(\omega_1 t)$) that was in between two DFT bins for a simple 4 point DFT. Here we see the Dirichlet Kernel response for each bin in the DFT. If the tone is exactly on a bin center, the frequency response for every other bin will be zero as described above (and thus we have the case of no "spectral leakage"). On the right we see the actual DFT magnitude for the given frequency explained as follows:

The top graphic shows the response for bin 0, and we see there will be a small response for the input frequency represented by the vertical blue bar.

The next graphic shows the response for bin 1, which would be a little larger.

The third graphic shows the response for bin 2, which has the largest response given the input frequency is closest to bin 2.
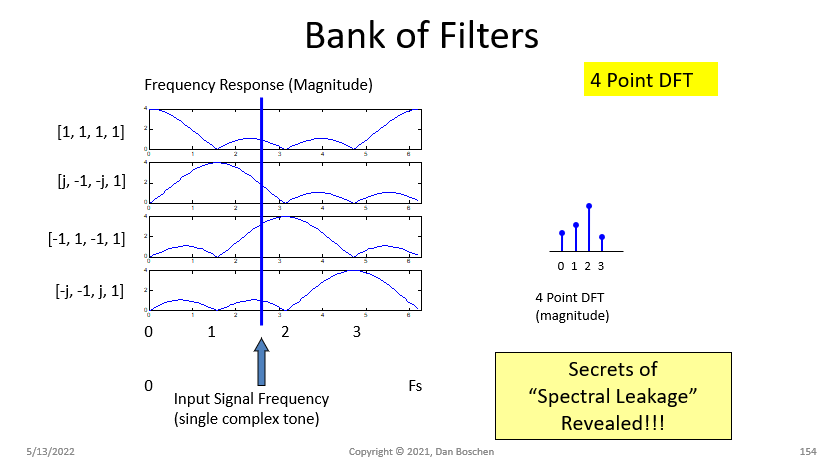
FFT response

For further details of this description, please see DSP.SE #82998.

$\endgroup$
1
$\begingroup$

Bin 1 -> [0Hz - 1Hz]

That's a false interpretation. The DFT uses and orthogonal set of base functions which are complex exponentials.

You can use the concepts bins, but the bins at centered at the base frequencies and the shape is that of a Dirichlet kernel (https://en.wikipedia.org/wiki/Dirichlet_kernel). , i.e. it's not rectangular.

The Dirichlet kernel has the property that for integer multiples of the DFT resolution the magnitude at the matching base frequency is 1 and zero at all other base frequencies.

So in your example, there is NO spectral leakage since your signal has the same frequency as one of the basis functions. If you want to see leakage you have to a non-basis frequency. For example 0.5, 1.3, etc.

Would the magnitude for example simply get cut in half and be assign to both bins equally?

No. The energy will be distributed over ALL bins following a Dirichlet Kernel

$\endgroup$
2
  • $\begingroup$ I think this makes sense. I forgot that the DFT is pretty much a sampled version of the DTFT. So practically speaking, a DFT bin is not really a bin since it technically has no width. Correct? $\endgroup$
    – Izzo
    Commented Oct 10 at 21:09
  • $\begingroup$ It has infinite width since its periodic If follows from the definition of the DFT that both time and frequency domain signals are periodic. That's the reason why it is a Dirichlet Kernel and not a sin(x)/x. The Dirichlet is the periodic repetition of the sinc function. $\endgroup$
    – Hilmar
    Commented Oct 11 at 13:26
0
$\begingroup$

I think there's some confusion on DFT bins versus, for example, range bins in radar. In radar, when your signal straddles two different range bins, there is a straddling loss as the energy is split between the two range bins. However, in the DFT, the "bins" are infinitesimally narrow (technically not but for sake of the argument) because the DFT is an orthobasis expansion (see Connection between Parseval's Theorem to Fourier Transform is Unitary). The key takeaway from the orthobasis expansion in this case is \begin{equation} \left\langle \phi_{\gamma}(t),\phi_{\gamma '}(t) \right\rangle = \begin{cases} 1, \: \gamma = \gamma ' \\ 0, \: \text{else} \end{cases} \end{equation} In the case of the DFT, the orthobasis function $\phi_{\gamma}(t)$ is discretized to become $\phi_{k}[n]=e^{-j\frac{2\pi kn}{N}}\;\forall\; k \in [0,N-1]$. When you have a signal that is not perfectly composed of the set of DFT basis functions, which means that the signal is not periodic over $N$ samples, the inner products violate the above takeaway. When this happens, spectral leakage results as none of the inner products will sum to 0 or 1. As Hilmar notes, the pattern of this leakage follows a Dirichlet kernel.

As for windowing, windowing only "increases" spectral leakage if the signal is perfectly composed of DFT basis functions, ie there is no spectral leakage to begin with, in which case you wouldn't need a windowing function. And even in that case, while it does induce a spectral leakage effect, it is really only because it broadens the mainlobe, which is a consequence of using windows. It is not really inducing any aperiodicity per say.

$\endgroup$

Your Answer

By clicking “Post Your Answer”, you agree to our terms of service and acknowledge you have read our privacy policy.

Not the answer you're looking for? Browse other questions tagged or ask your own question.