2
$\begingroup$

What does it mean for a power spectral density exhibiting leakes from one frequency bin to other.

I am reading a book which states the following:

"Often the time series we use as input for our algorithm will have a non-zero DC average, which may even slowly change over time. Such a DC average will show up in the first frequency bin (m = 0) of the resulting spectrum. If a window function is used or the average changes over time, it will also leak into adjacent frequency bins, possibly masking low-frequency signals."

Could somebody explain what does this mean? Why does a window leak power into adjacent frequency bins?

I also read the following which has probably a similar connection and it would be good to get an explanation on this as well:

"If we simply take a stretch of length N out of a time series containing a sinusoidal signal and perform a DFT, we will most likely find that the sinusoidal signal which we might naively expect to result in a sharp peak in only one frequency bin, will instead show up as something ugly, The reason is that the DFT implicitly assumes that the signal is periodic, i.e. that the time series of length N repeats itself infinitely in a cyclic manner. If the frequency of the sinusoidal input signal is not an exact multiple of the frequency resolution fres, i.e. does not fall in the exact center of a frequency bin, this assumption is not true, and the DFT will ‘see’ a discontinuity between the last sample and the first sample due to the cyclic continuation. That discontinuity spreads power all across the spectrum"

What does it mean for DFT to "see" a discontinuity as written above"?

EDIT:After accepting answer:

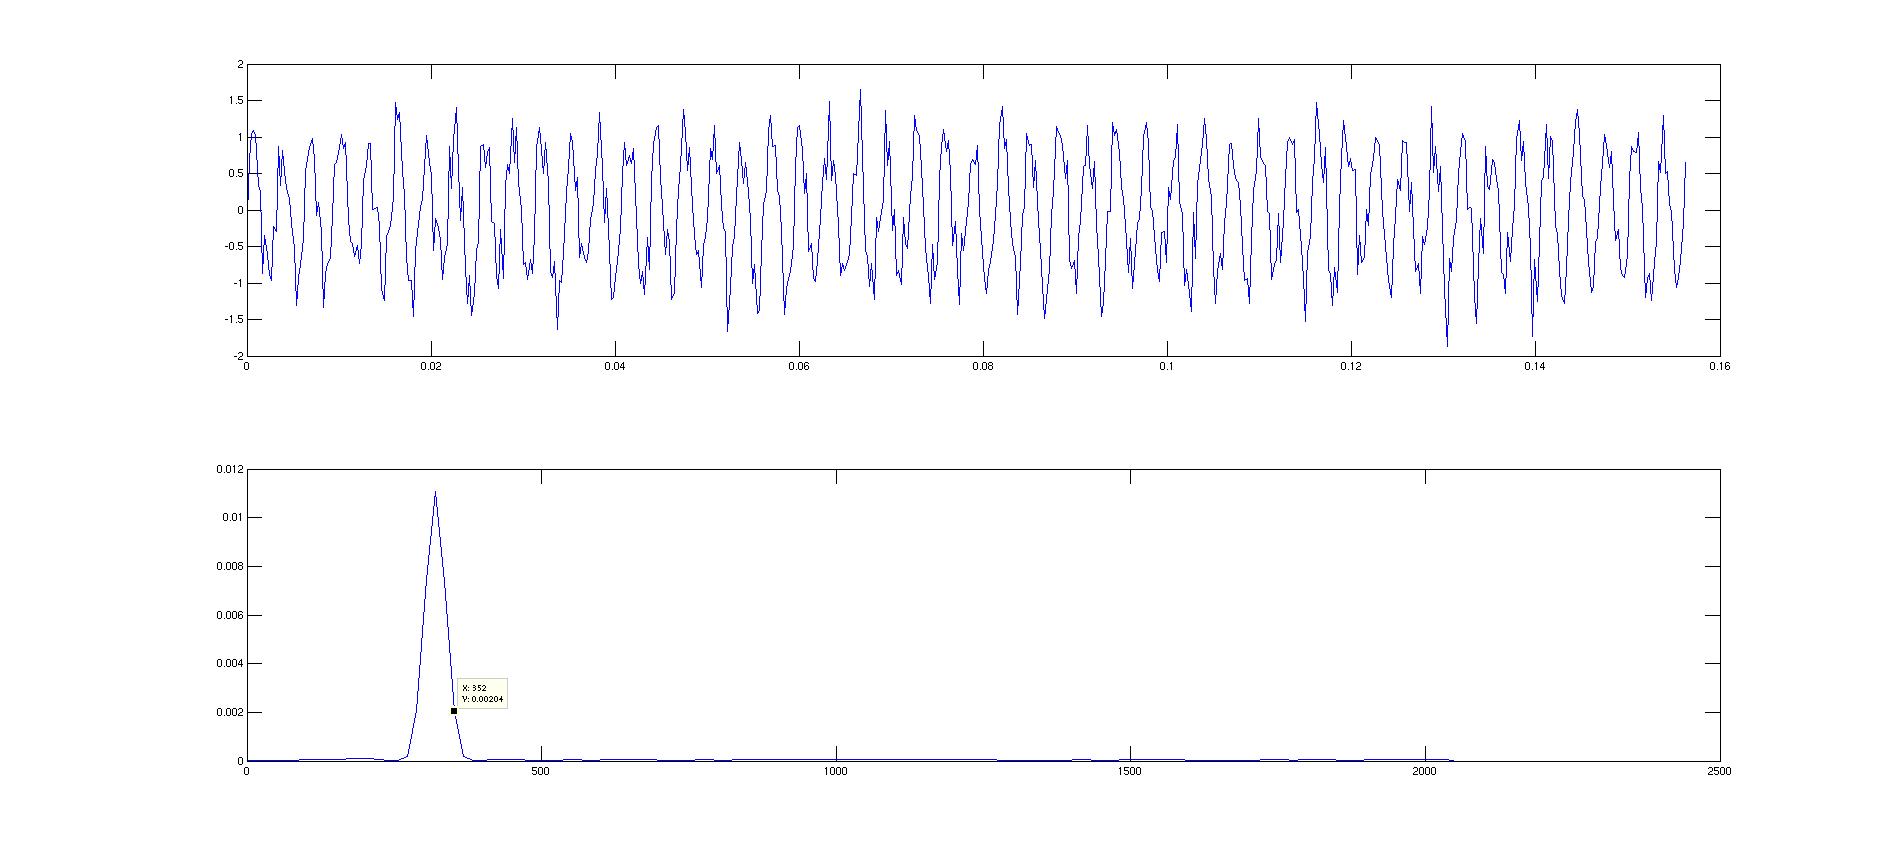
I ran a MATLAB simulation (code below) in which the frequency of sinusoidal is exactly a multiple of resolution of the PSD and thus falls directly at the center of a frequency bin, still there is leakage into neighboring bins (3 to the right and three to the left of this bin in which the sinusoidal lies). This spilling gets more and more resolved as I increase the window length. Which would seem to suggest that even the frequencies that fall directly at the center of frequency bins leak into the adjacent frequency bins and the amount of leakage will depend on the shape of the window and the length of the window. Is this understanding correct?

MATLAB code:

%%%%%%%%%%%%%%%%%%%% PSD Estimation%%%%%%%%%%%%%%%%%%%%%%%%%%%%%%%


close all;
N=50; %number of periods

Fs= 4096;
snr=10;

M=256; %length of FFT

Fres=Fs/M;

Mul_factor=20;

F_c=Fres*Mul_factor;  %in Hz%

Window_length=128;

Overlap=floor(0.4*Window_length);
x=0:1/Fs:N*(1/F_c);
y=sin(2*pi*x*F_c) + 1/sqrt(snr).*randn(1,length(x));

[ppx,w]=pwelch(y,Window_length,Overlap,M,Fs);


figure;
hold on;
subplot(2,1,1);
plot(x,y);
subplot(2,1,2);
plot(w,ppx);
hold off;

enter image description here

$\endgroup$

1 Answer 1

3
$\begingroup$

Could somebody explain what does this mean? Why does a window leak power into adjacent frequency bins?

You can think of frequency bins as imposing an artificial frequency grid which allows only certain frequencies to fit nicely within it (producing a sharp peak) and all other frequencies are smeared across adjacent bins thus producing spectral leakage.

This means that only those frequencies that are centered exactly on bin frequency will not produce leakage.

Since the bandwidth of a bin (i.e frequency resolution) is simply the sampling rate divided by the dft length, we can conclude that only frequencies that are exact integer multiples of the frequency resolution will not produce spectral leakage.

For example, if the sampling frequency is 8000 Hz and dft length is 1024, the frequency resolution is computed as

 frequency_resolution = 8000 / 1024 = 7,8125 Hz

So, if your signal contains frequencies which are integer multiples of 7,8125, you'll get no leakage (e.g 1*7,8125, 2*7,8125, 3*7,8125 and so on)

If, however, your signal contains a frequency that is somewhere between 2 adjacent bins, you'll get spectral leakage, which I think is intuitive because no single bin can fit that frequency component exactly.

UPDATE (trying to answer the comments below):

It's true that windowing does introduce some additional leakage on its own. But even if you don't use windowing at all (which corresponds to a rectangular window), you'll still get spectral leakage (provided that the frequency under examination is not an integer multiple of the frequency resolution). In fact, since using a rectangular window (no window at all) produces the worst leakage, using overlapping windows other than the rectangular helps reduce the spectral leakage.

So, why do we have spectral leakage in the first place?

Remember that DFT assumes that a signal is periodic. Since the frequency resolution is fixed (e.g 7,8125 Hz in the example above) for every bin, which in this case corresponds to exactly 1024 samples, we can see that a single bin can hold exactly one cycle of a 7,8125 Hz frequency , 2 cycles of 15,625 Hz frequency, 3 cycles of 24,4375Hz frequency and so on. This is true for every bin, which means that there'll be no discontinuities either within a bin or between adjacent bins.

However, if we now change our frequency to something that fits between two bins, things change. This new frequency will take either more (or fewer) than 1024 samples (one or more cycles), which means that we'll get discontinuities either within a bin or between neighbouring bins and this in turn creates spectral leakage.

Hope this helps.

$\endgroup$
23
  • $\begingroup$ But each bin also has a range of frequencies if we talk about the power spectral density in the continuous frequencies, (digital or analog frequency), then why would say a freuency very near the centre of centre of a frequency bin produce the spectral leakage, is it because we don't actually have a real calculated estimate for this nearby freuency? And hence it is approximated which has an inherent roll off? $\endgroup$ Commented Apr 10, 2020 at 12:57
  • $\begingroup$ Or could it be that in essence the windowing operation is a convolution of the actual signal PSD with the magnitude sqaured window, when the window is exactly the centre of the frequency bin it's main lobe is contained entirely in the bin,however anything off the centre and the main lobe itself is not contained in the bin and hence the spilling to other bins? $\endgroup$ Commented Apr 10, 2020 at 13:06
  • $\begingroup$ @Dsp guy sam, I've updated my answer. $\endgroup$
    – dsp_user
    Commented Apr 10, 2020 at 16:48
  • 1
    $\begingroup$ @Dsp guy sam, so use a window that fits in a single bin. The rectangular window produces the narrowest main lobe at the expanse of the higher noise floor. Also, don't use any overlapping to reduce the effect of windowing as much as possible. $\endgroup$
    – dsp_user
    Commented Apr 13, 2020 at 8:22
  • 1
    $\begingroup$ @Dsp guy sam, yes, windows do matter and I did mention that in my answer. So perhaps what this discussion really comes down to is , everything else being equal, frequencies that are an exact multiple of the frequency resolution will produce a sharper peak than if we're dealing with frequencies that are located somewhere between bins. Let's leave it at that :) $\endgroup$
    – dsp_user
    Commented Apr 13, 2020 at 8:36

Your Answer

By clicking “Post Your Answer”, you agree to our terms of service and acknowledge you have read our privacy policy.

Not the answer you're looking for? Browse other questions tagged or ask your own question.