1
$\begingroup$

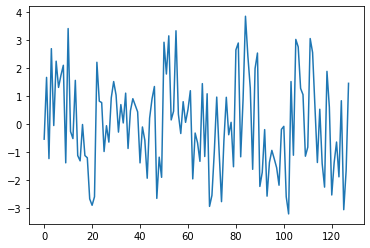
Consider N-point sine signal mixed with a random noise (implemented in Python below):

import numpy as np
%matplotlib inline
import matplotlib.pyplot as plt

N = 128 # num of points in signal
t = np.arange(0,N,1)
sample_num = 5
freq = sample_num/N
sigma = 1.5
# random noise
noise = np.random.normal(0, sigma, len(t))
noise = noise-np.mean(noise)
signal = np.sin(2*np.pi*freq*t)+noise

plt.plot(signal)

Noisy signal

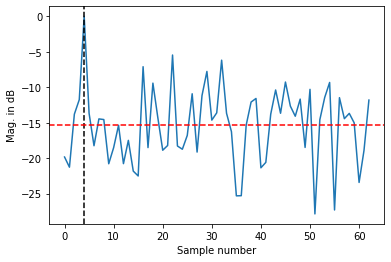
and let's see its power spectrum in dB (normalized to the maximum power):

FFT_power_mag = abs(np.fft.fft(signal))**2
FFT_dB = FFT_power_mag/max(FFT_power_mag)
FFT_dB = 10*np.log10(FFT_dB)

plt.plot(FFT_dB[1:len(FFT_power_mag)//2])
plt.ylabel('Mag. in dB')
plt.xlabel('Sample number')
plt.axvline(sample_num-1, color='k', linestyle='--')
plt.axhline(np.mean(FFT_dB[1:]), color='r', linestyle='--')
print(np.mean(FFT_dB[1:]))

$-15.367730381221198$

enter image description here

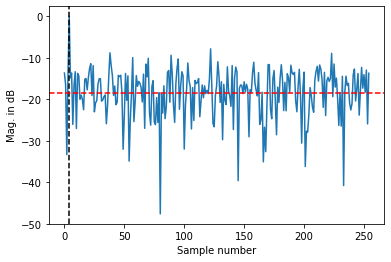
Defining SNR as the signal power to the average noise power, we get ~$15$ dB. Next, consider the same (frequency, sigma for noise etc.), but M-point (M>N) noisy signal and for simplicity I just output its power spectrum:

enter image description here

For this signal SNR ~$18$ dB. Here (page 95, formula (3-33)) I found definition for calculating one SNR over another as the following:

$$SNR_M = SNR_N+20\cdot log_{10}\left(\sqrt{\frac{M}{N}}\right),$$

which I don't completely understand. My first question is where does it come from, that the standard deviation value of the DFT bin's output noise is proportional to $\sqrt{N}$ (or $\sqrt{M}$)? The second question is how can I derive $20\cdot log_{10}\left(\sqrt{\frac{M}{N}}\right)$ from such definition?

$\endgroup$
0

1 Answer 1

3
$\begingroup$

The power level of each bin in the power within the resolution BW of the DFT (think of each bin as the average power within the bandwidth of a bandpass filter centered on each bin, which is what the DFT is: a bank of filters). The resolution BW is the sampling rate divided by the total number of bins and your noise power is spread evenly over the sampling rate. So if you increase the total number of samples, the power indicated by each bin will go down exactly as you observe.

From this we have $P_{noise}$ which is the total power as white noise spread evenly from $-f_s/2$ to $f_s/2$ where $f_s$ is the sampling rate. If we increase the number of points in the DFT from $N$ to $M$, without changing the sampling rate (thus we have changed the time duration), there will be no change in $P_{noise}$ but we will change the power that we measure in each bin as follows:

$$P_{N} = \frac{P_{noise}}{N}$$

$$P_{M} = \frac{P_{noise}}{M}$$

Where $P_{N}$ and $P_{M}$ represent the noise power in each bin for an $N$ point DFT and $M$ point DFT respectively (assuming white noise).

From the second equation we can equate $P_{noise}$ in terms of $P_{M}$ and $M$ and substitute this into the first equation as follows:

$$ P_{noise} = M P_{M}$$

$$P_{N} = \frac{P_{noise}}{N} = \frac{M }{N}P_{M}$$

So for example, if we doubled the number of points from $N$ to $2N$, it's intuitive that the power in each bin will go down by a factor of 2, thus the power in each bin with $N$ points will be double the power in each bin with $2N$ points.

To derive the equation, this comes directly from the power in each bin is given by $f_s/N$ for $N$ total bins. This the power ratio for two different total number of bins is simply $M/N$. For a power ratio to get dB we use $10Log()$ as follows:

$$10Log_{10}(M/N)$$

This is the same as

$$10Log_{10}(\sqrt{M/N}^2)$$

Which is then:

$$20Log_{10}(\sqrt{M/N})$$

Since $log(x^n)=n log(x)$

The formula given for SNR as:

$$SNR_M = SNR_N + 20 log_{10}\bigg(\sqrt{\frac{M}{N}}\bigg)$$

is referring to the achievable SNR for a narrow band signal that occupies in either case just one bin (such as a single tone). So this formula says that the SNR for a single tone relative to the noise in none bin in an M point DFT would be the larger by a factor of $10log_{10}(M/N)$ of the SNR for the same tone with the same total white noise power sampled at the same rate with a smaller N point DFT. (I find referring to this as SNR misleading since we are often interested in the SNR of a modulated signal that would occupy many bins, in which case the SNR is independent of $M$ and $N$).

An additional word of caution- averaging the dB of a power measurement results in a significant error in the estimate of actual power (the result will be close to 2.5 dB higher than actual if Gaussian white noise, as nicely explained in this old HP app note #1303). Assuming the DFT was not windowed (or the losses due to windowing were properly accounted for as explained in more detail here) the power estimate is best found from the mean of the sum of the squares (as a complex conjugate product) of the DFT bins and then taking the dB of that quantity.

Case in point with OP’s example, the standard deviation was 1.5 and 128 samples, so the true power in each bin would be given as:

$$10log_{10}(1.5^2/128)= -17.55 \text{ dB}$$

$\endgroup$
10
  • $\begingroup$ Dan, thank you so much for such a great and comprehensive answer!) Am I right, in your answer $f_s/N$ is the power in each bin? if yes, could you please explain it a bit, and I still don't undersatnd why the standard deviation of noise is proportional to $\sqrt{N}$(( $\endgroup$
    – Curious
    Commented Jan 13, 2023 at 19:40
  • 1
    $\begingroup$ and the DFT conserves all energy: So the power in the original time domain signal is the power in the DFT (Parsevel's Theorem) and in the case of white noise that power is spread evenly across all frequencies. So if each filter has an effective bandwidth that is 1 bin wide, and if that "white noise" for a discrete time system is spread evenly over all $N$ bins, then the power in each bin will go down by $1/N$. Variance is a power quantity while the standard deviation is a magnitude quantity, as the square root of the variance. So if the power goes by $1/N$, the standard dev goes $1/\sqrt{N}$ $\endgroup$ Commented Jan 13, 2023 at 21:47
  • 1
    $\begingroup$ The details here may help provide further insight: dsp.stackexchange.com/questions/80805/about-psd-scailing-factor/… $\endgroup$ Commented Jan 14, 2023 at 19:45
  • 1
    $\begingroup$ @Curious ok I updated my answer - please see if it clears up your question or if I am missing something. $\endgroup$ Commented Jan 14, 2023 at 21:52
  • 1
    $\begingroup$ now it is absolutely clear! the thing that confused me was the values by the magnitude axis in minus dB, so I stuck at understanding of the relation $\frac{P_N}{P_M}=\frac{M}{N}$, thank you so much for your best (as usual) explanations and detailed descriptions!) $\endgroup$
    – Curious
    Commented Jan 15, 2023 at 20:16

Your Answer

By clicking “Post Your Answer”, you agree to our terms of service and acknowledge you have read our privacy policy.

Not the answer you're looking for? Browse other questions tagged or ask your own question.