6
$\begingroup$

I have a GMSK modulator in MATLAB and wish to generate AWGN with a specific SNR, and I'm having some issues figuring out just how.

I have found this step-by-step process to generate zero-mean Gaussian noise with a specified power spectral density W0:

  1. Form Gaussian distributed random variable: w = randn(1,N)
  2. Map top zero mean: w = w - sum(w)/N
  3. Compute average power: Pw = sum(w.^2)/N
  4. Form w = w.*sqrt(W0*fs/Pw)

Note: As pointed out by Deve, steps 2 and 3 should not be necessary, since randn() generates a random variable with zero-mean and power 1. However, it is possible that the mean and power may be slightly off, since the vector is of finite length. For my application, neglecting these steps give a slightly less accurate SNR.

So, how do I determine which power spectral density I need to achieve a specified SNR? I understand that SNR is defined as $SNR=P_s/P_n$. Measuring the signal power using $P_s=\frac{1}{N}\sum_{n=0}^{N-1} s[n]^2$ and then isolating $P_n=P_s/SNR$ seems trivial, but how do I relate $P_n$ to $W_0$?

Thanks in advance!

Edit: Using Deves answer, I have written the following code:

s           = signal;
L           = length(s);

% Convert SNR from dB
SNRdB       = 10;
SNR         = 10^(SNRdB/10);

% Measure average power of signal
Ps          = sum(s.^2)/L;

% Calculate wanted noise power
Pn          = Ps/SNR;

% Generate random vector and ensure 0-mean 
w           = randn(1,L);
w           = w-sum(w)/L;

% Scale to wanted power
Pw          = 1/L*sum(w.^2);
w           = sqrt(Pn/Pw).*w;

% Measure resulting SNR
Pw_meas     = 1/L*sum(w.^2);
SNRdB_meas  = 10*log10( Ps/Pw_meas ); % Gives 10.0000

And here's a plot in time domain for anyone interested:
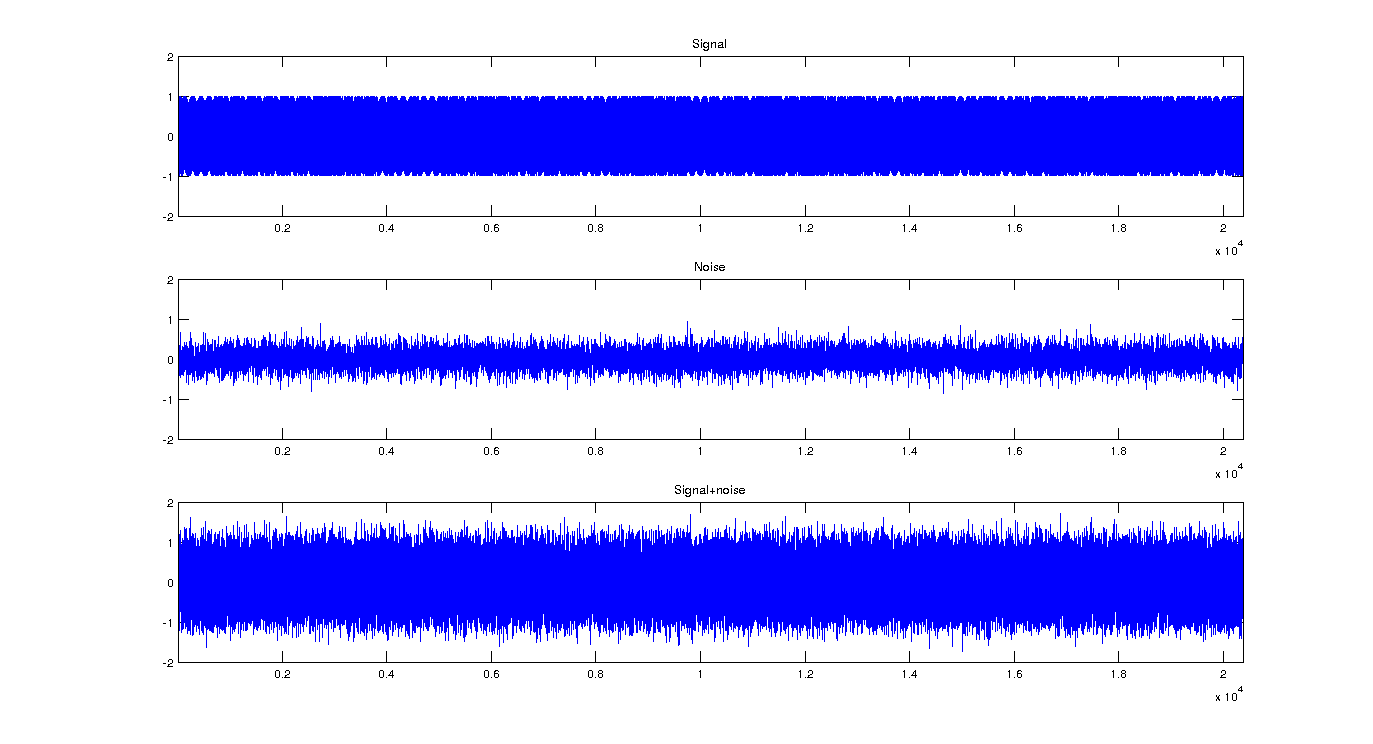
Signal and noise in timedomain

It doesn't seem like a lot of noise - but I guess the calculation of SNRdB_meas is quite foolproof.

[PSD plot removed]

$\endgroup$
4
  • $\begingroup$ I'm not sure if the extension of your question shouldn't be a new question, because this is about estimating the PSD with Matlab and the derivation of SNR from it. $\endgroup$
    – Deve
    Commented Apr 11, 2013 at 12:29
  • $\begingroup$ @Deve - thank you, I have removed the followup part of the question. $\endgroup$
    – Tausen
    Commented Apr 11, 2013 at 13:27
  • $\begingroup$ What is the W .can please describe w $\endgroup$
    – Moo Elden
    Commented Jul 17, 2019 at 15:13
  • $\begingroup$ @MooElden this question was asked and answered in 2013 -- it's unlikely you'll get the answers you need by commenting here. I suggest you open a new question instead with more details on what you're trying to achieve and what you need help to understand. $\endgroup$
    – Tausen
    Commented Jul 20, 2019 at 10:08

2 Answers 2

4
$\begingroup$

First a comment on your noise-generation process. The Matlab function randn() generates Gaussian noise with zero mean and mean power 1. So steps 2 and 3 are obsolete.

If you'd like to achieve a given SNR, then creating the noise signal with the wanted power is as simple as

w = w .* sqrt(P_n)

Where P_n is the mean noise power and can be calculated by the equation you've already found yourself. Actually you're doing the exact same thing in your step 4, from which you can also derive that

P_n = W0 * fs

assuming that fs is the sampling frequency of your system and thus equal to the bandwidth and using Pw = 1.

$\endgroup$
3
  • $\begingroup$ Thank you for the answer, Deve! I believe steps 2 and 3 are merely to ensure zero mean and power 1 - I suppose it could be slightly off since we use this finite-length sequence of random numbers. I have actually tried using this method you describe- if I measure the signal and noise powers using $\frac{1}{N}\sum x[n]^2$ and calculate SNR using $P_s/P_n$, the results are a bit off ($\approx \pm 1/2$dB) but quite satisfactory still. I wonder why? $\endgroup$
    – Tausen
    Commented Apr 11, 2013 at 8:04
  • $\begingroup$ You're right that a series drawn from randn() will never perfectly achieve mean power 1 and zero mean. What is the value of N in your calculation? You might want to increase it. $\endgroup$
    – Deve
    Commented Apr 11, 2013 at 11:24
  • $\begingroup$ I'm sorry, I must've done something wrong when I measured +/- 1/2 dB off. Thank you for your help! I just edited my original question and added my code - as noted, the measurement now gives what I wanted. The psd-plot seems off, though. $\endgroup$
    – Tausen
    Commented Apr 11, 2013 at 12:25
1
$\begingroup$

This is how I compute the EbN0, you must realize that exist a little difference between it and SNR(depends on modulation type).

%signal energy
calculate the mean symbol energy
% Bit energy for each symbol
Eb   = Es/bit_per_symbol;
EbNo = 10^(EbNo_dB/10);
% Noise variance   
No   = Eb/EbNo;                             
noise = sqrt(No/2)*(randn(1,length(symbol))+j*randn(1,length(symbol))); 
noise_symbol = symbol + noise;

I'm using the pseudo-code above in several systems with success. You may pay attention to the characteristics of the system you are simulating as: Number of bits per symbol, overhead in the symbol etc.

You may wish to take several symbols for a better estimate on each Eb/N0 value.

I don't know GMSK modulators very well so I can't give you a working code, but I guess you can handle the simulation with the code above.

$\endgroup$
3
  • $\begingroup$ Thanks for the answer! I see that you calculate complex noise, but I'm just using a simple real signal at the moment. Could I use the same method to generate real noise, and in that case, would I simply have to replace sqrt(No/2) with sqrt(No) in line 8? Another question - how do I calculate the mean symbol energy? I only have one bit per symbol, so would it be as simple as $\frac{1}{N}\sum s[n]^2$ within one symbol? Thanks again! $\endgroup$
    – Tausen
    Commented Apr 11, 2013 at 8:09
  • $\begingroup$ Yes, you're right about use No intead of No/2, as far as I remember, I'm using this code for a long time now and always with complex signals. About the mean symbol energy you're also sum the energy of N symbols and divide by N. I don't understand the last part of your answer "within one symbol". You are taking several symbols to average and apply noise. $\endgroup$ Commented Apr 11, 2013 at 10:36
  • $\begingroup$ Alright, thank you - I will keep your code for reference, as I may switch to complex signals later. Thank you for your help! $\endgroup$
    – Tausen
    Commented Apr 11, 2013 at 12:30

Your Answer

By clicking “Post Your Answer”, you agree to our terms of service and acknowledge you have read our privacy policy.

Not the answer you're looking for? Browse other questions tagged or ask your own question.