1
$\begingroup$

So I've run into some trouble in trying to plot the PSD of an OFDM signal. Specifically, I cant see how we go from the discrete domain to the continuous in time domain.

I have a time vector, which is sample at a rate of 10Khz, over a duration of 100s

t = 0:1/1e4:100

I then generate a signal by low-pass filtering some noise at a maximum frequency

f_max = 50;                                              % maximum freq of message signal
x     = randn(size(t));                                  % Generate some noise
x     = filter2(fir1(10*ceil(f_s/f_max),2*f_max/f_s),x); % Low pass filter the noise
x     = x-mean(x);                                       % Remove any DC offset
x     = x/sqrt(mean(x.^2));                              % Normalise the signal

This is my 'continuous in time' signal which is then sampled at a rate of 8Hz to give by discrete in time signal

f_sample          = 8;
number_of_symbols = f_sample*t(end);
sample_indices    = round((0:number_of_symbols -1)*(length(x)-1)/(number_of_symbols -1))+1;
xSampled          = x(sample_indices);

This is then quantised and QAM modulated in the discrete domain

xQuant = quantiz(xSampled,partition,codebook); % quantisation
xMod   = qammod(xQuant,M);                     % QAM modulation

This is where my problem comes. The next step for OFDM would then be to convert this frequency domain representation to a continuous in time representation using an IFFT. But lets say I have FFT_Length= 64, I'd split my QAM modulated signal into 64 vectors of length number_of_symbols/64, and this would give me 64 vectors out, each of length number_of_symbols/64, one for each subcarrier - we have remained in the discrete domain?

If this was a single carrier scheme this is when id apply pulse shaping to the QAM symbols and upsample the signal frequency to the original 10khz, however pulse shaping is not used in OFDM. I was thinking we could either upsample the QAM symbols prior to the OFDM modulation by padding with 0's for the remainder of the symbol period, or do the same but pad with the QAM value, however in both cases the resulting FFT is like a square wave - stuck at a one value for a symbol period, then switches immediately to another.

So my question:

how do I convert a series of QAM pulses to a continuous time signal using the IFFT (in OFDM)

Many thanks :-)

$\endgroup$
1
  • $\begingroup$ I am not sure that I fully understand your question but take a look this question and tell us whether that is the answer. $\endgroup$
    – AlexTP
    Commented Apr 13, 2022 at 8:12

1 Answer 1

2
$\begingroup$

You simply take the IFFT of the same length vector to get the time domain signal. Note that relative to each sub-carrier, you have multiple samples per QAM "symbol". If you wish to interpolate to higher samples, the FFT should be zero padded in the center with the value in the shared bin at index N/2 split in half. For a simple 6 bin example note that bin 0 is the DC bin, bin 1 and 2 are the positive frequency bins, bin 3 is the Nyquist bin and bins 4 and 5 are the negative frequency bins as described below. This approach will provide "perfect" interpolation in that it will maintain all subcarrier orthogonality. Traditional interpolation with zero insert and filtering of the time domain signal would likely degrade EVM due to the inter-carrier interference the filter would introduce (but that would not be of any concern for purposes of creating a power spectral density).

Bin Index          0     1     2    3    4    5
As pos/neg         0     1     2    N   -2   -1
Samples            x[0] x[1] x[2] x[3] x[4] x[5] 

Here interpolation to a higher sampling rate would properly done with zero inserts and splitting the Nyquist bin (if non-zero already) as follows (I show a 3 zero insert but could just as well be 6 zeros to exactly interpolate by 2 or more zeros for higher interpolation factors:

Bin Index          0     1     2    3    4    5    6      7     8    9
As pos/neg         0     1     2    3    4    N   -4     -3    -2   -1
Samples            x[0] x[1] x[2] x[3]/2 0    0    0    x[3]/2 x[4] x[5] 

If there were an odd number of samples, then the Nyquist bin would not be included and in this case there would simply be the DC bin 0 followed by $(N-1)/2$ "positive frequency axis" samples, followed by the zero inserts, followed by the final $(N-1)/2 "negative frequency axis" samples (no splitting of a Nyquist bin).

The IFFT output is the OFDM signal as transmitted in the time domain. To observe the power spectral density of the actual signal as transmitted, an FFT should be done over a duration of multiple OFDM symbols, each with the cyclic prefix added, which will then provide an averaged power spectral density. The other option is to use the Welch method or other similar periodograms which serve to reduce the noise in the spectrum at the expense of resolution bandwidth (the spectrum is created multiple times with less samples in each and averaged). Below is a Python function I wrote that can be easily ported to MATLAB for simple spectrum plots which properly windows the waveform and compensates for resolution bandwidth in the FFT for reporting the levels of sinusoidal tones (so over-reports by a couple dB any spread signals that occupy multiple tones given the resolution bandwidth occupies more than one bit):

import numpy as np
import scipy.fftpack as fft
import scipy.signal as sig
import matplotlib.pyplot as plt

def winfft(vec, fs=1., full_scale=1., beta=12., n_samp=None):
    '''
    vec: input signal
    fs: sampling rate (default 1)
    full_scale: normalization (default 1)
    beta: Kaiser window beta (default 12)
    n_samp: number of samples (default vec length)
    '''

    input_len = np.shape(vec)[0]
    if n_samp == None:
        n_samp = input_len
    elif n_samp < input_len:
        vec = vec[:n_samp]
    
    # only window data, not zero padded signal:
    win_len = input_len if n_samp > input_len else n_samp 

    win = sig.kaiser(win_len, beta)
    winscale = np.sum(win)
    win_data = win * vec 

    # scaled fft
    fout = 1./(winscale*full_scale) * fft.fft(win_data, n_samp)

    fout = fft.fftshift(fout)

    # create frequency axis
    faxis = np.array(range(n_samp)) * fs / n_samp - fs / 2

    return faxis, fout

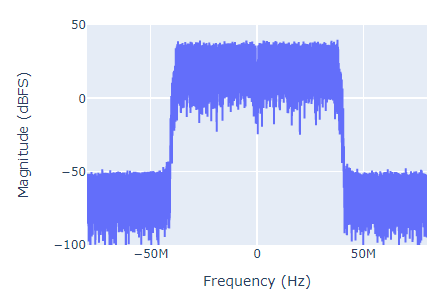
The following is an example OFDM spectrum with 256 QAM subcarriers plotted with this function after doing an interpolate by 2 using the zero insert method above:

OFDM

$\endgroup$
9
  • $\begingroup$ Thanks, this helps! What I don't understand about your answer is how this applies to multiple subcarriers. Lets say im trying to take a single carrier system and instead use OFDM and transmit my data over 4 subcarriers. Now if I originally have an length [1 x N] vector of QAM symbols I'd think to reshape this to a [4 x N/4] sized array which matches the 4 subcarriers. I now need to upsample this to match a time vector of length M, would I therefore have to zero-pad each row of the [4 x N/4] sized array to make it size [4 x M] and then apply a length M FFT to each row? doesn't seem right! $\endgroup$
    – Jonah F
    Commented Apr 13, 2022 at 22:05
  • $\begingroup$ Do you understand how each subcarrier in OFDM is one bin in the DFT? My plot above of the spectrum is 256 QAM subcarriers each with a symbol rate of 312.5KHz. This is the spectrum of all those carriers running in parallel which is basically the data mapped to FFT bins. $\endgroup$ Commented Apr 13, 2022 at 22:12
  • $\begingroup$ I thought I did, but now i'm not so sure. Put it this way, if I had a time vector of 10,000 samples over 100s, and then 800 QAM symbols of a sampled signal regularly spaced over the same 100s, how exactly would I map the 800 symbols to the input of the (I)FFT so that I am transmitting the data in parallel over 8 subcarriers for 100s? I assume with 8 subcarriers we'd need a length 8 (I)FFT - this would produce 8 output samples which id add together to get the symbol for that time step ... but then what about all the timesteps where the input sample is zero? I hope this Q makes sense. thanks $\endgroup$
    – Jonah F
    Commented Apr 13, 2022 at 22:24
  • $\begingroup$ I think this post may answer your additional question: dsp.stackexchange.com/questions/80946/… Please review that and if you are still asking the above question, post under that question and we can clear that up. After you read/digest that, read this post response again to see if I answered your original question properly. $\endgroup$ Commented Apr 13, 2022 at 22:30
  • $\begingroup$ Right right, Ive had a look at that. From what Ive deduced then, we would split the [1 x N] vector into a [4 x N/4] array and then zero pad the length 4 column vectors to with the scheme described in your original answer to length 4*(M/N), then apply an IFFT of the same length to give, a size [4(M/N) x N/4] array over the N/4 sample periods. This is then parallel-to-serial and the resulting row vector is length [1 x 4(M/N)(N/4)] = [1 x M], so one value for each timestep! I think this is correct! Using that method I produced imgur.com/ZtErksz (1khz carrier) - looks good :-) $\endgroup$
    – Jonah F
    Commented Apr 13, 2022 at 23:05

Your Answer

By clicking “Post Your Answer”, you agree to our terms of service and acknowledge you have read our privacy policy.

Not the answer you're looking for? Browse other questions tagged or ask your own question.