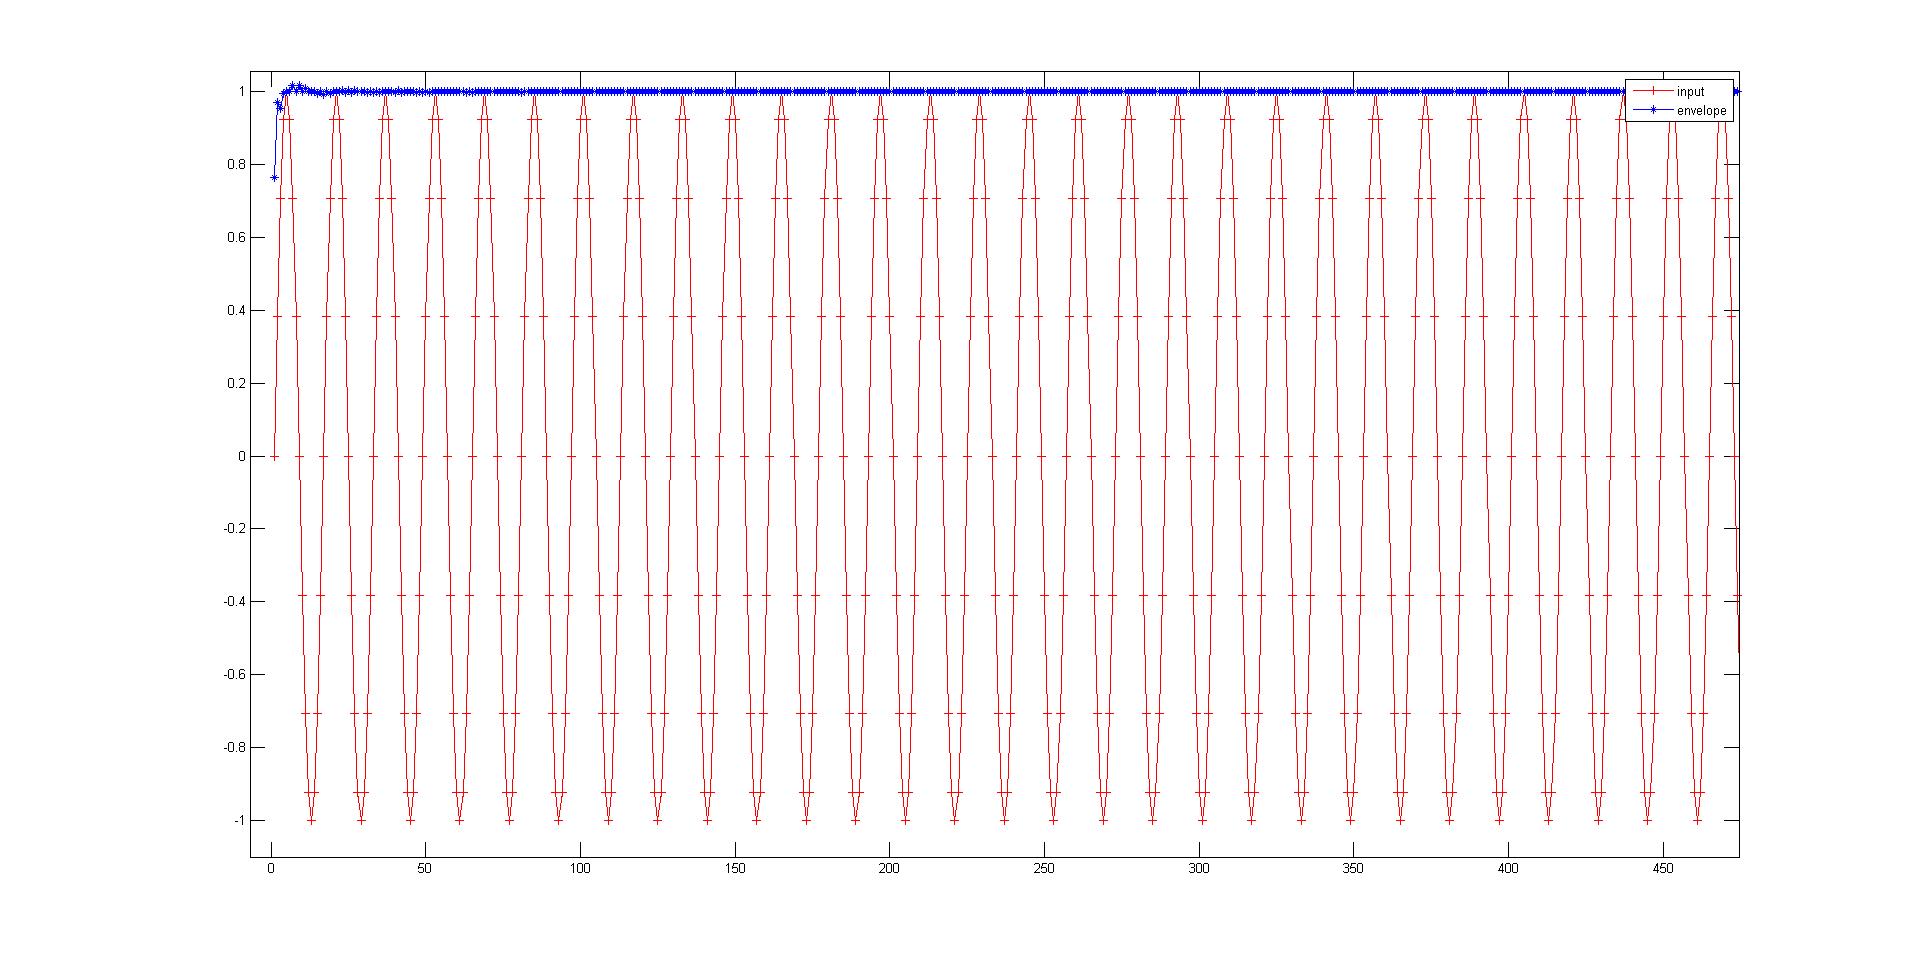
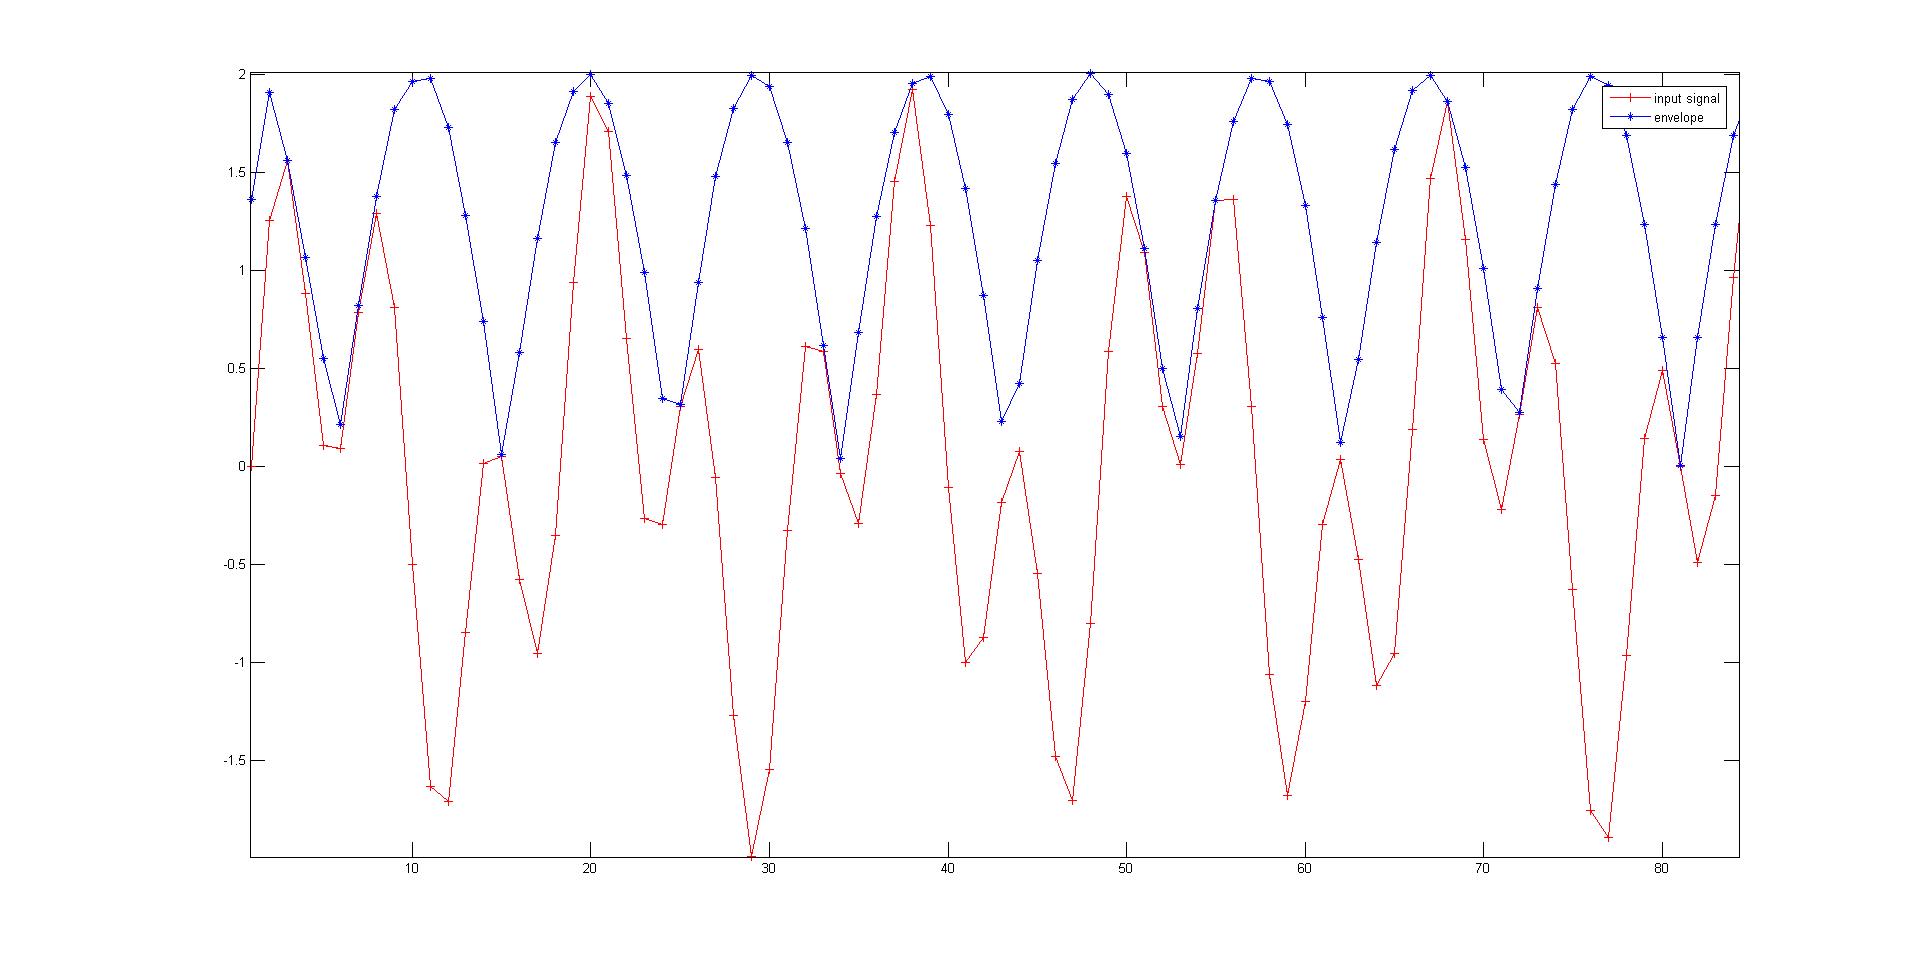
I have a sine wave of frequency 1kHz sampled at 16kHz. I need to find the envelope of this signal using hilbert transform in MATLAB.I have used the inbuilt function abs(hilbert(input_signal)) and got the result as expected. Now, when I change the input signal to an addition of two sine waves of frequency 1kHz and 2.7kHz and then find the envelope using the hilbert transform method, I am getting a result as shown in the attachment. Is that the correct envelope


-
1$\begingroup$ Just a quick remark regarding envelopes: Most of the times when you are looking for a signal envelope, the Hilbert transform is not the best choice. The complex magnitude of an analytic signal is only meaningful, in the sense of what you intuitively expect from an enveloping signal, if the analytic signal is a single-component signal. That means if your signal contains more than one oscillating component, then you should look at other methods. $\endgroup$– JazzmaniacCommented Mar 14, 2022 at 14:53
-
6$\begingroup$ Depends on what you want to do with the envelope, but Hilbert Transform is terrible choice for broad band audio signals . There are RMS are magnitude detectors with low pass filter or some averaging, lossy peak detector, standard exponential attack/decay detectors, linear attack detectors, etc. It really depends on what specific properties of the envelope are most important $\endgroup$– HilmarCommented Mar 14, 2022 at 18:28
-
$\begingroup$ @Deepa what kind of information are you trying to extract from your envelope? $\endgroup$– JazzmaniacCommented Mar 14, 2022 at 20:10
-
$\begingroup$ @Hilmar, is there any reference to why "Hilbert Transform is terrible choice for broad band audio signals"? $\endgroup$– Gideon Genadi KoganCommented May 29, 2022 at 8:50
-
$\begingroup$ @GideonGenadiKogan simple trial and error will do: grab a speech or music signal, calculate the analytic signal and look at the result. The imaginary part sounds very similar to the real (since the Hilbert Transform is just a monaural phase shift). The magnitude still has the temporal fine structure of the original signal but it sounds very distorted. It doesn't look at all like what most people would call "envelope". The HT is useful for narrow band or spectrally sparse signals. Not so much for spectrally dense broadband signals $\endgroup$– HilmarCommented May 30, 2022 at 12:03
1 Answer
To be clear, the Hilbert Transform in MATLAB does not actually return the Hilbert Transform, but returns the Analytic Signal given as:
$$x_a(t) = x(t) + j \hat x(t)$$
Where it is the imaginary component $\hat x (t)$ which is actually the Hilbert Transform of $x(t)$. Regardless it is the magnitude of the Analytic Signal which will give us the envelope as the OP is properly doing.
The addition of two sinusoids of equal amplitude is a similar result to Double Side-Band Suppressed Carrier (DSB-SC) AM modulation of a single sinusoid carrier that is at the frequency midway between the two sinusoids, and the modulation rate would be half the distance between the two sinusoids (as a modulation signal sinusoid). We achieve DSB-SC AM modulation by multiplying the carrier sinusoid by the modulation sinusoid, due to the trigonometric relationship:
$$2\cos(\alpha)\cos(\beta)= \cos(\alpha+\beta)+\cos(\alpha-\beta)$$
And we see in the first form above how if we designate $\cos(\beta)$ to be a "carrier frequency" that $\cos(\alpha)$ is sinusoidally modulating the amplitude of the carrier.
In this case with a frequency of 1 KHz and 2.7 KHz, the carrier would be at $(1 + 2.7)/2 = 1.85$ KHz and the modulation would be at $2.7-1.85 = 0.85$ KHz, and we get the result:
$$\cos(2 \pi 1000 t) + \cos(2 \pi 2700 t) = 2\cos(2 \pi 850 t)\cos(2 \pi 1700 t)$$
The factor of 2 is an arbitrary scaling, but the envelope as the amplitude of the modulated carrier should be the amplitude of the 850 Hz sinusoid. I cannot read the time axis in the OP's plot, but it would have the general shape of a rectified sinusoid as shown.
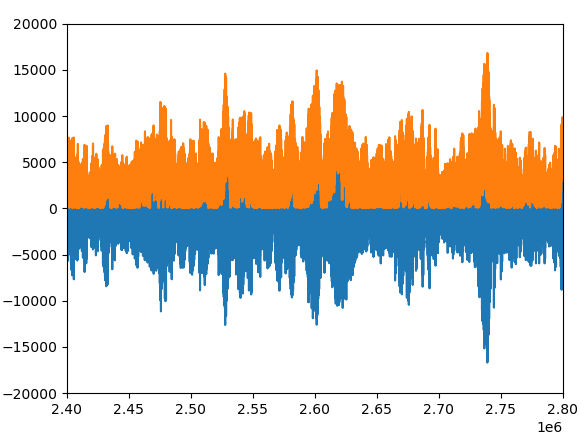
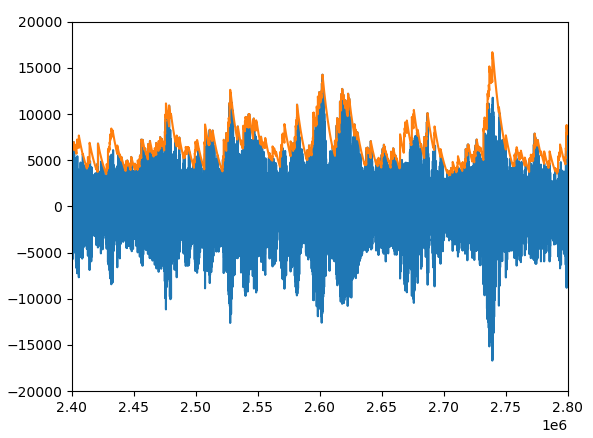
Demonstrating specifically what Hilmar and Jazzmaniac have suggested in the comments, the Hilbert Transform and Analytic Signal is a poor choice for envelope extraction of a broadband signal.
Below is an extraction of a Yo-Yo Ma playing Bach with the magnitude of the analytic signal as the envelope in orange. Immediately below that is the same extraction of the envelope using a lossy peak detector.


