To be clear, the Hilbert Transform in MATLAB does not actually return the Hilbert Transform, but returns the Analytic Signal given as:
$$x_a(t) = x(t) + j \hat x(t)$$
Where it is the imaginary component $\hat x (t)$ which is actually the Hilbert Transform of $x(t)$. Regardless it is the magnitude of the Analytic Signal which will give us the envelope as the OP is properly doing.
The addition of two sinusoids of equal amplitude is a similar result to Double Side-Band Suppressed Carrier (DSB-SC) AM modulation of a single sinusoid carrier that is at the frequency midway between the two sinusoids, and the modulation rate would be half the distance between the two sinusoids (as a modulation signal sinusoid). We achieve DSB-SC AM modulation by multiplying the carrier sinusoid by the modulation sinusoid, due to the trigonometric relationship:
$$2\cos(\alpha)\cos(\beta)= \cos(\alpha+\beta)+\cos(\alpha-\beta)$$
And we see in the first form above how if we designate $\cos(\beta)$ to be a "carrier frequency" that $\cos(\alpha)$ is sinusoidally modulating the amplitude of the carrier.
In this case with a frequency of 1 KHz and 2.7 KHz, the carrier would be at $(1 + 2.7)/2 = 1.85$ KHz and the modulation would be at $2.7-1.85 = 0.85$ KHz, and we get the result:
$$\cos(2 \pi 1000 t) + \cos(2 \pi 2700 t) = 2\cos(2 \pi 850 t)\cos(2 \pi 1700 t)$$
The factor of 2 is an arbitrary scaling, but the envelope as the amplitude of the modulated carrier should be the amplitude of the 850 Hz sinusoid. I cannot read the time axis in the OP's plot, but it would have the general shape of a rectified sinusoid as shown.
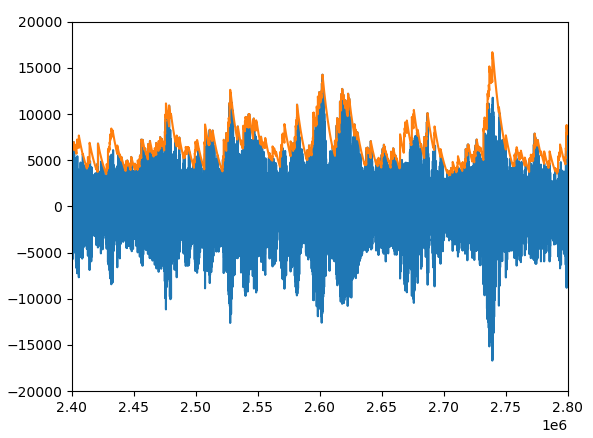
Demonstrating specifically what Hilmar and Jazzmaniac have suggested in the comments, the Hilbert Transform and Analytic Signal is a poor choice for envelope extraction of a broadband signal.
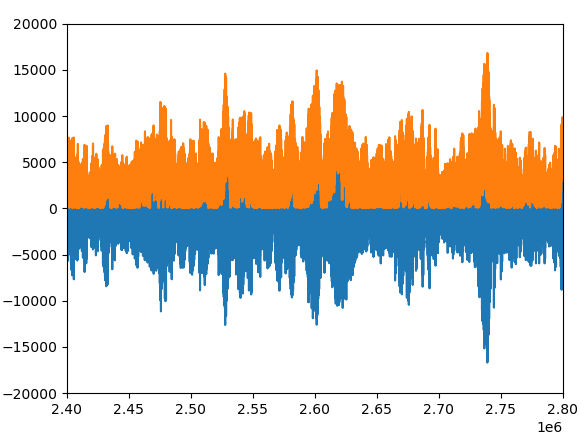
Below is an extraction of a Yo-Yo Ma playing Bach with the magnitude of the analytic signal as the envelope in orange. Immediately below that is the same extraction of the envelope using a lossy peak detector.


