2
$\begingroup$

I'm doing an assignment for the course Signal analysis where I have to analyse a signal. I've tried quite some things now but it's still bothering me that the FFT is looking weird, and not looks like the 'normal look' FFT's we learned in class.

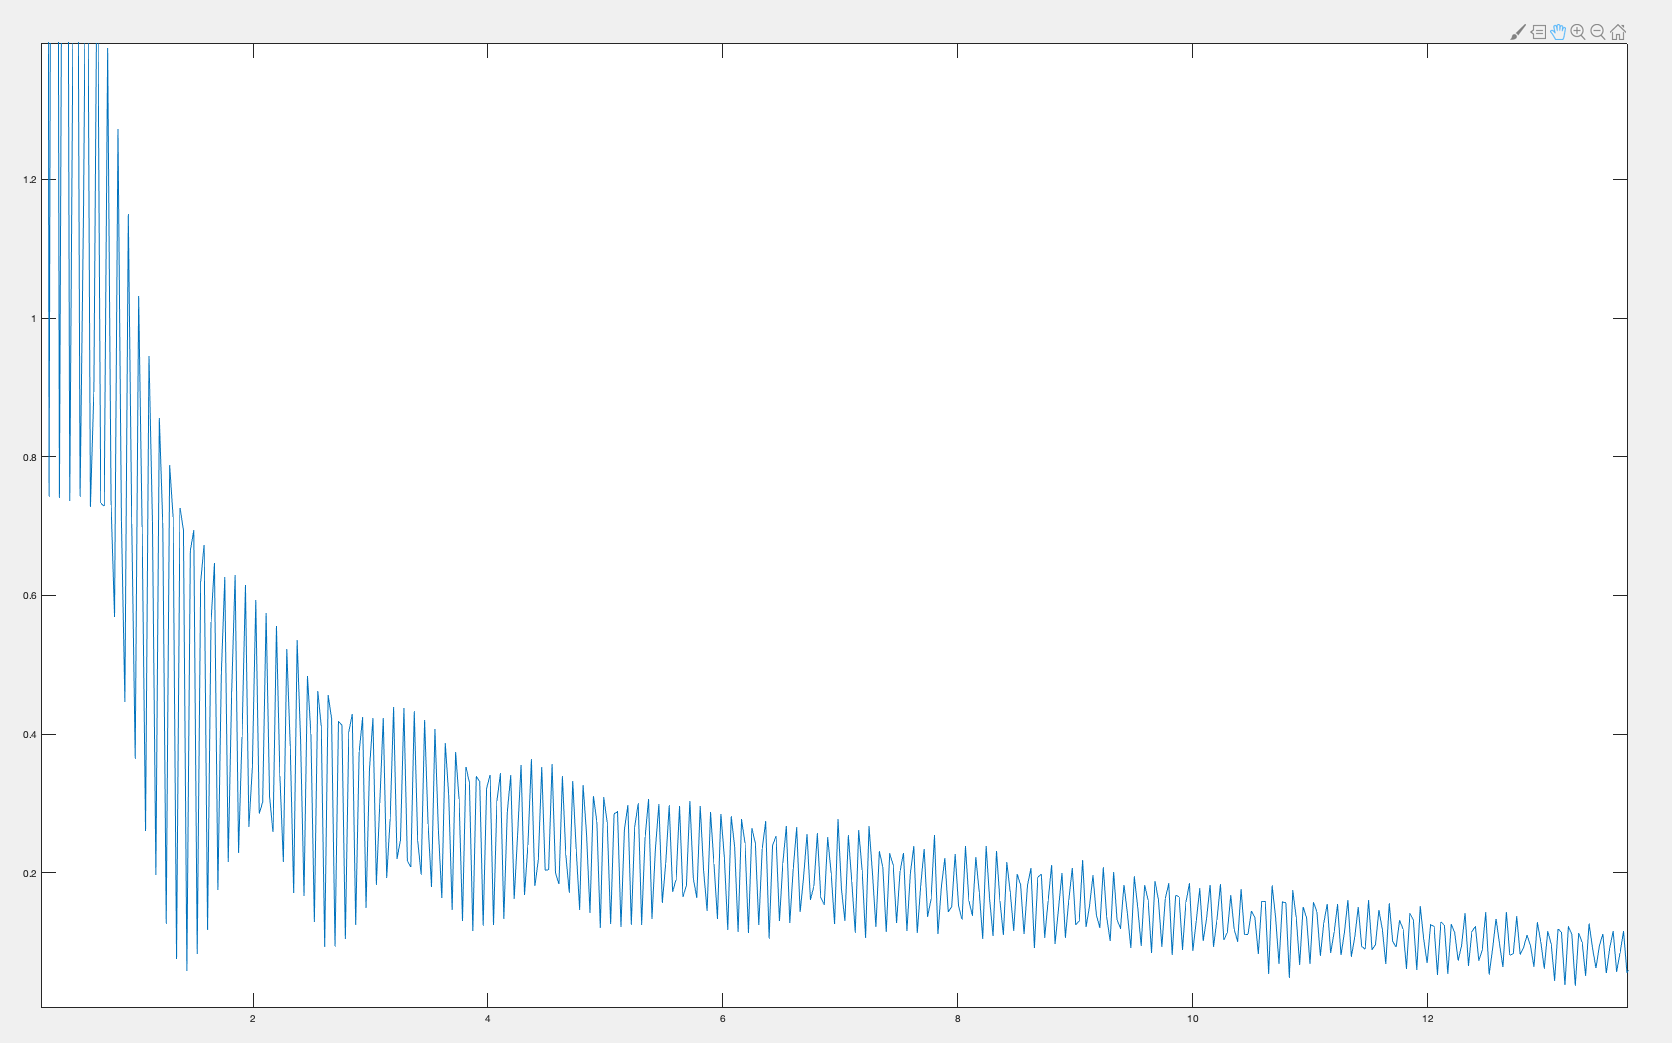
FFT (absolute values of complex values): enter image description here

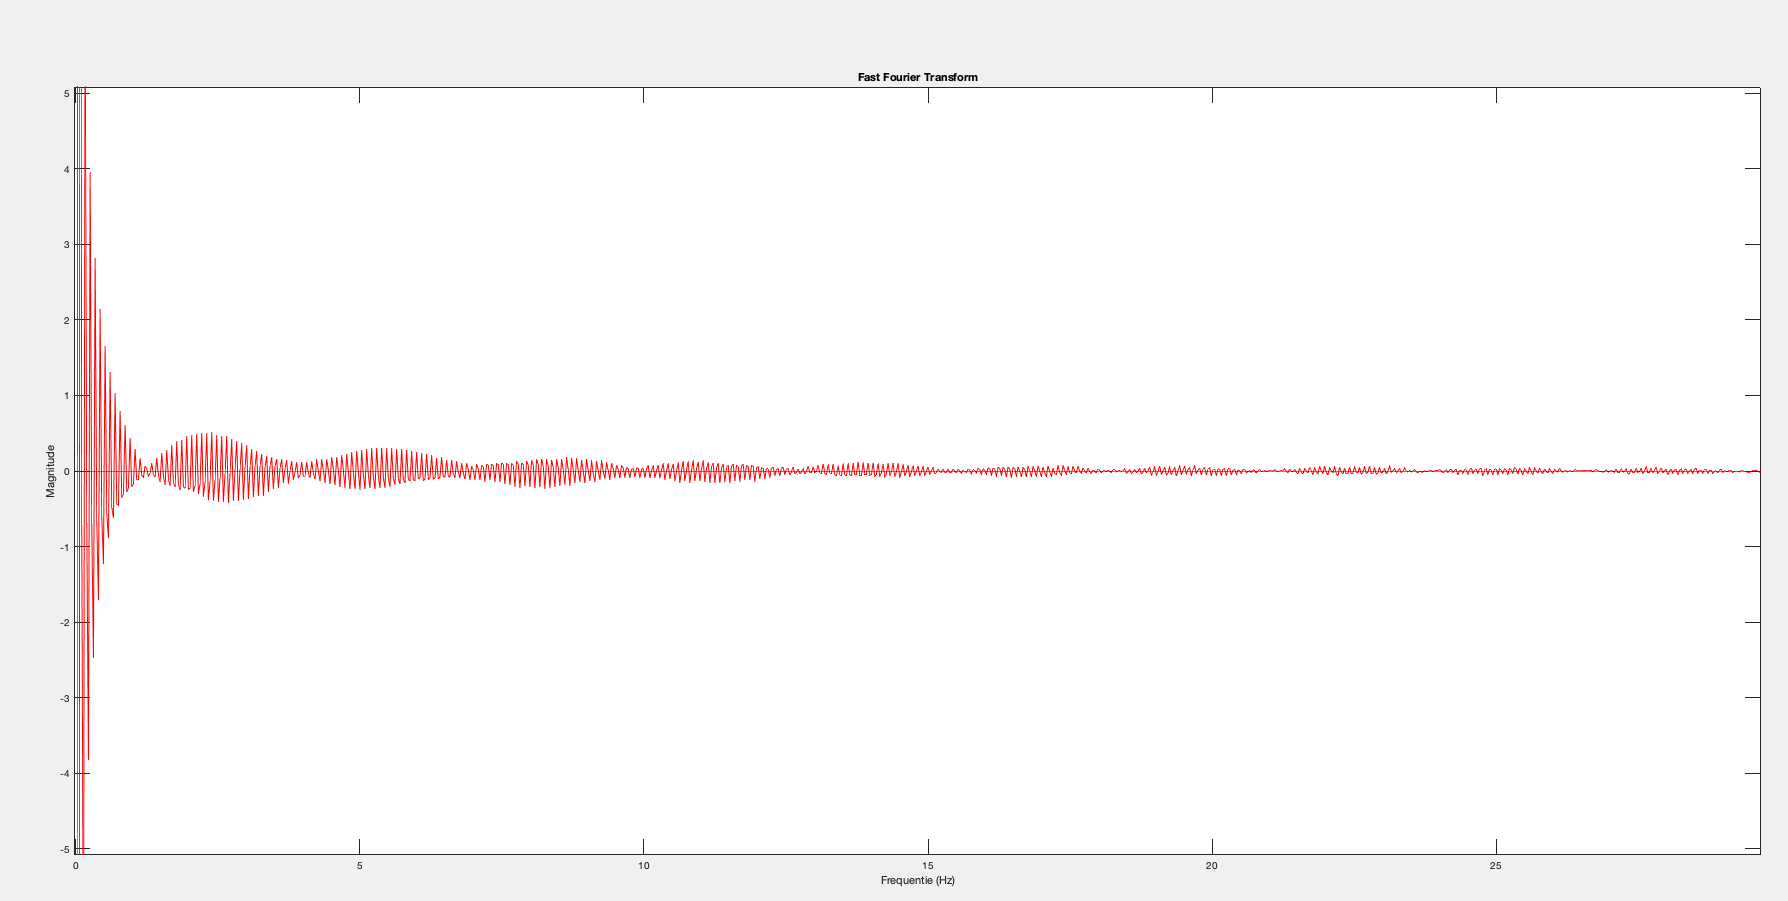
FFT (no absolute values):

The FFT seen in the image above is zoomed in on the frequency range 0-30Hz. The rest of the frequency range does not show a lot of (high) peaks, which probably are caused by noise.

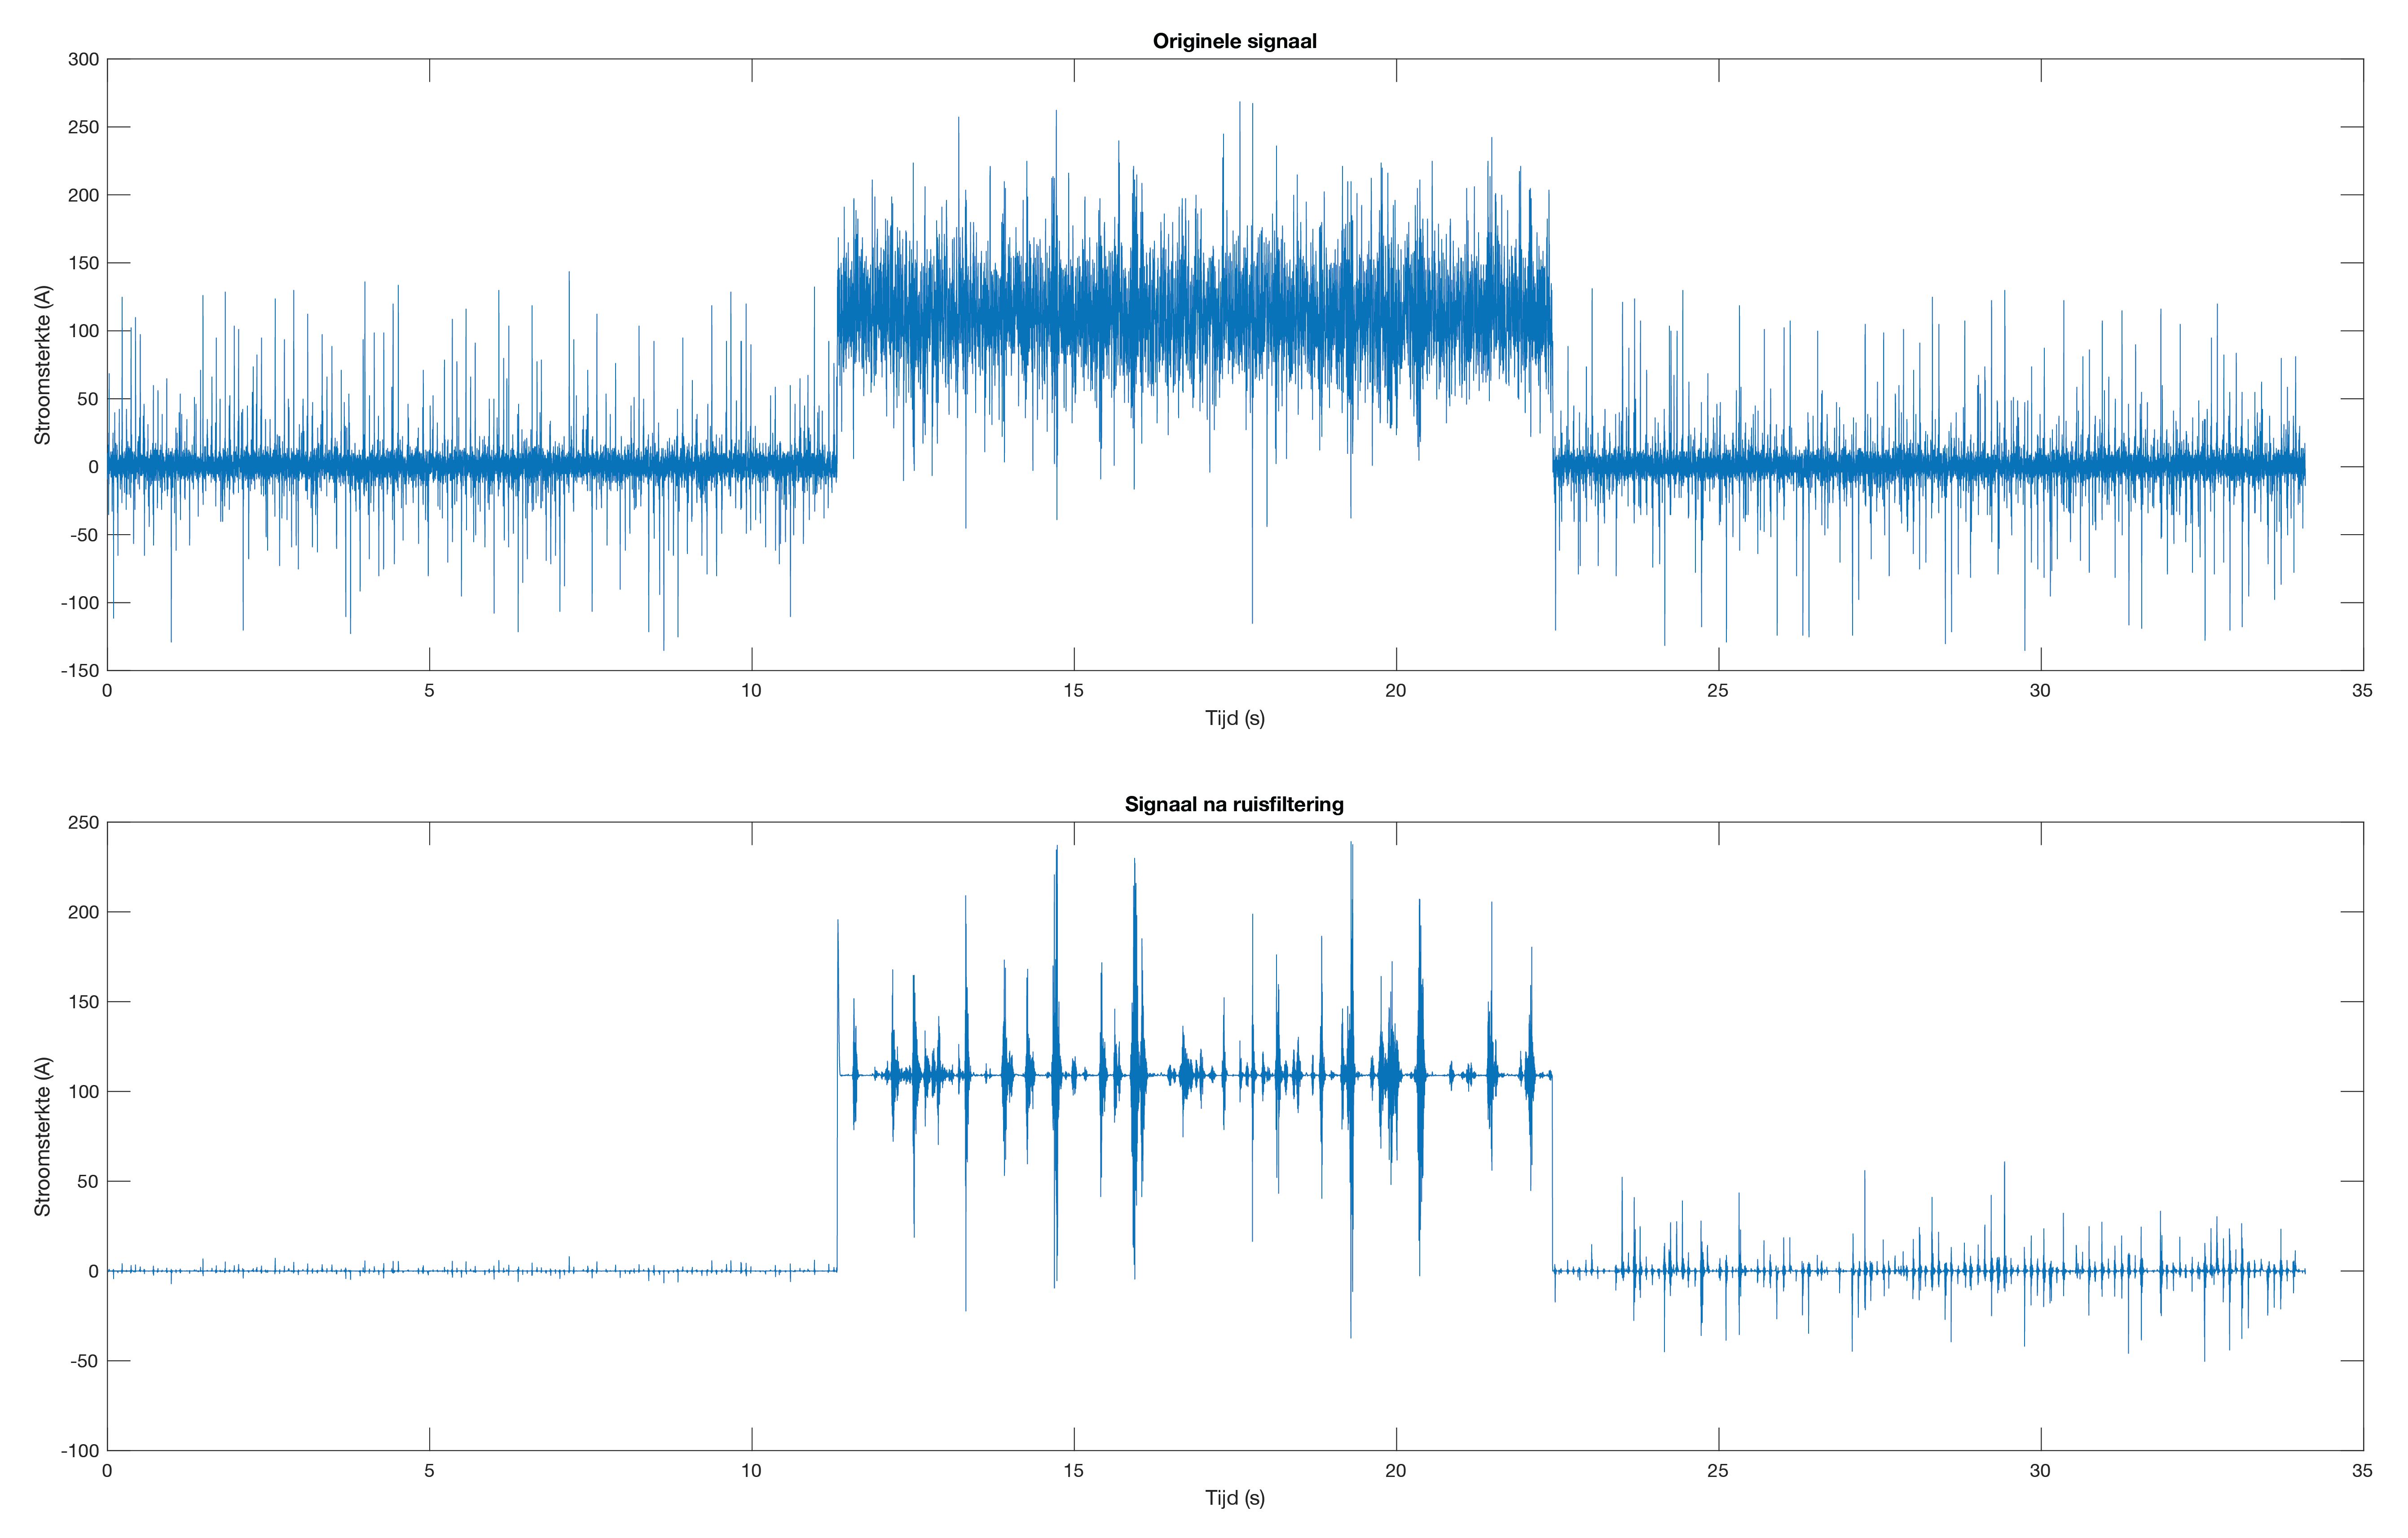
The signal is created during a method of welding, using an oscilloscope with a sampling frequency of 1000Hz. I've filtered the signal to remove noise, and after that the signal is converted to the frequency spectrum using the fft function of MATLAB.

Signal before and after filtering: enter image description here
My general question is, can the shown FFT be valid or did I make a mistake? I estimated the ground frequency to be around 5.5Hz, can I say this when I take one period of the big sinusoidal wave? I also noticed there are about 64 little sinusoidal waves inside one (ground??) period, is this an high harmonic wave form?.

If my theory is right, what causes the fft to be a damped sinusoidal form?

The code I use is basically the following. I leave the part of the noise filtering out because I don't think it's necessary for this question. The dataset is an matrix of 40100 rows.

fs = 1000;
cleanSignaal = data(:,4);
fftSignal = fft(cleanSignaal)/lenght(cleanSignaal);
f = fs/(2*length(fftSignal)):fs/length(fftSignal):fs;
plot(f,abs(fftSignal));
xlim([0 fs(m)/2]);
title('Fast Fourier Transform')
xlabel('Frequentie (Hz)')
ylabel('Magnitude')
$\endgroup$
8
  • $\begingroup$ please provide the code you used to generate this and the data. Also, how are you filtering the data and what is "welding"? $\endgroup$ Commented Oct 11, 2018 at 20:15
  • $\begingroup$ @Jost Please edit to include the images directly in the question, it will be easier for readability. $\endgroup$
    – Basj
    Commented Oct 11, 2018 at 20:21
  • $\begingroup$ The assignment was to analyze the current signals generated during short-circuit welding. I'm filtering the data using a Wiener filter (nl.mathworks.com/matlabcentral/fileexchange/7673-wiener-filter). I've added the code above. I've also added an image of the signal before and after filtering. $\endgroup$
    – user38162
    Commented Oct 11, 2018 at 20:28
  • $\begingroup$ It still looks a little strange. But the damped sinusoid (sinc function) is caused by using a rectangular window in the time domain which translates to a sin(x)/x function in the frequency domain. $\endgroup$ Commented Oct 11, 2018 at 20:31
  • $\begingroup$ Is there any wat to get the fft more like a plot like this? i.sstatic.net/jeIDT.jpg $\endgroup$
    – user38162
    Commented Oct 11, 2018 at 22:22

1 Answer 1

1
$\begingroup$

What you have is a very sharp rectangular boxcar shaped function. It is approximately centered at the mid point of your data set. Your magnitude spectrum looks correct, in that it is a really low fundamentally frequency with a ton of harmonics. Your FFT without ‘absolute values’ is presumably plotting just either the real or imaginary values. The oscillation in that plot occurs because of where that pulse is centered in the data set. It’s unlikely that plot has any useful information. I have no idea what you are trying to find from this endevour, but if you were interested in the period of the pulse you could zero of the end of the data set, providing more granular frequency data that you could use to measure the fundamental. That or you could just measure it directly, which is probably a lot easier.

$\endgroup$
1
  • $\begingroup$ Thanks for your answer, it helped me understand a bit more of what’s happening. I’ve already tried to plot the fft of a small part of the relevant dataset, but it doesn’t look like it has a big effect. I’ve just counted the pulses in a certain time frame to estimate the fundamental frequency of the signal. $\endgroup$
    – user38162
    Commented Oct 12, 2018 at 11:08

Your Answer

By clicking “Post Your Answer”, you agree to our terms of service and acknowledge you have read our privacy policy.