added 139 characters in body
Source Link
user38162
user38162

I'm doing an assignment for the course Signal analysis where I have to analyse a signal. I've tried quite some things now but it's still bothering me that the FFT is looking weird, and not looks like the 'normal look' FFT's we learned in class.

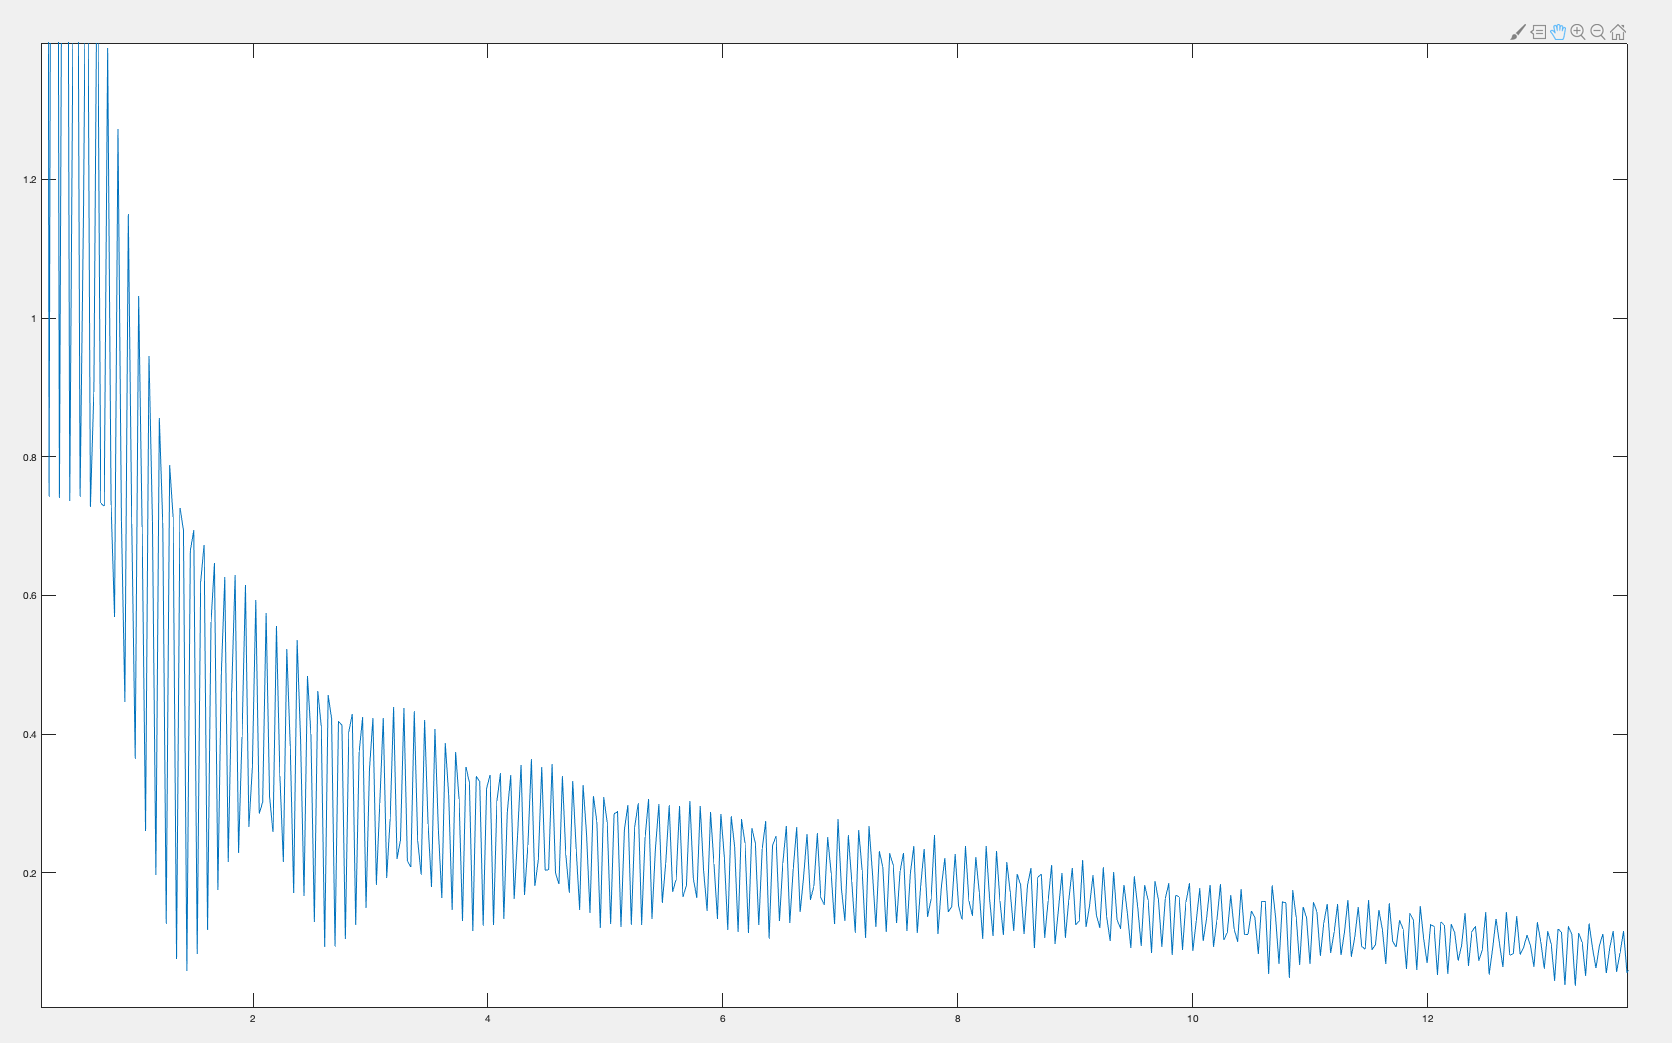
FFT (absolute values of complex values): https://imgur.com/a/pYK3ENK enter image description here

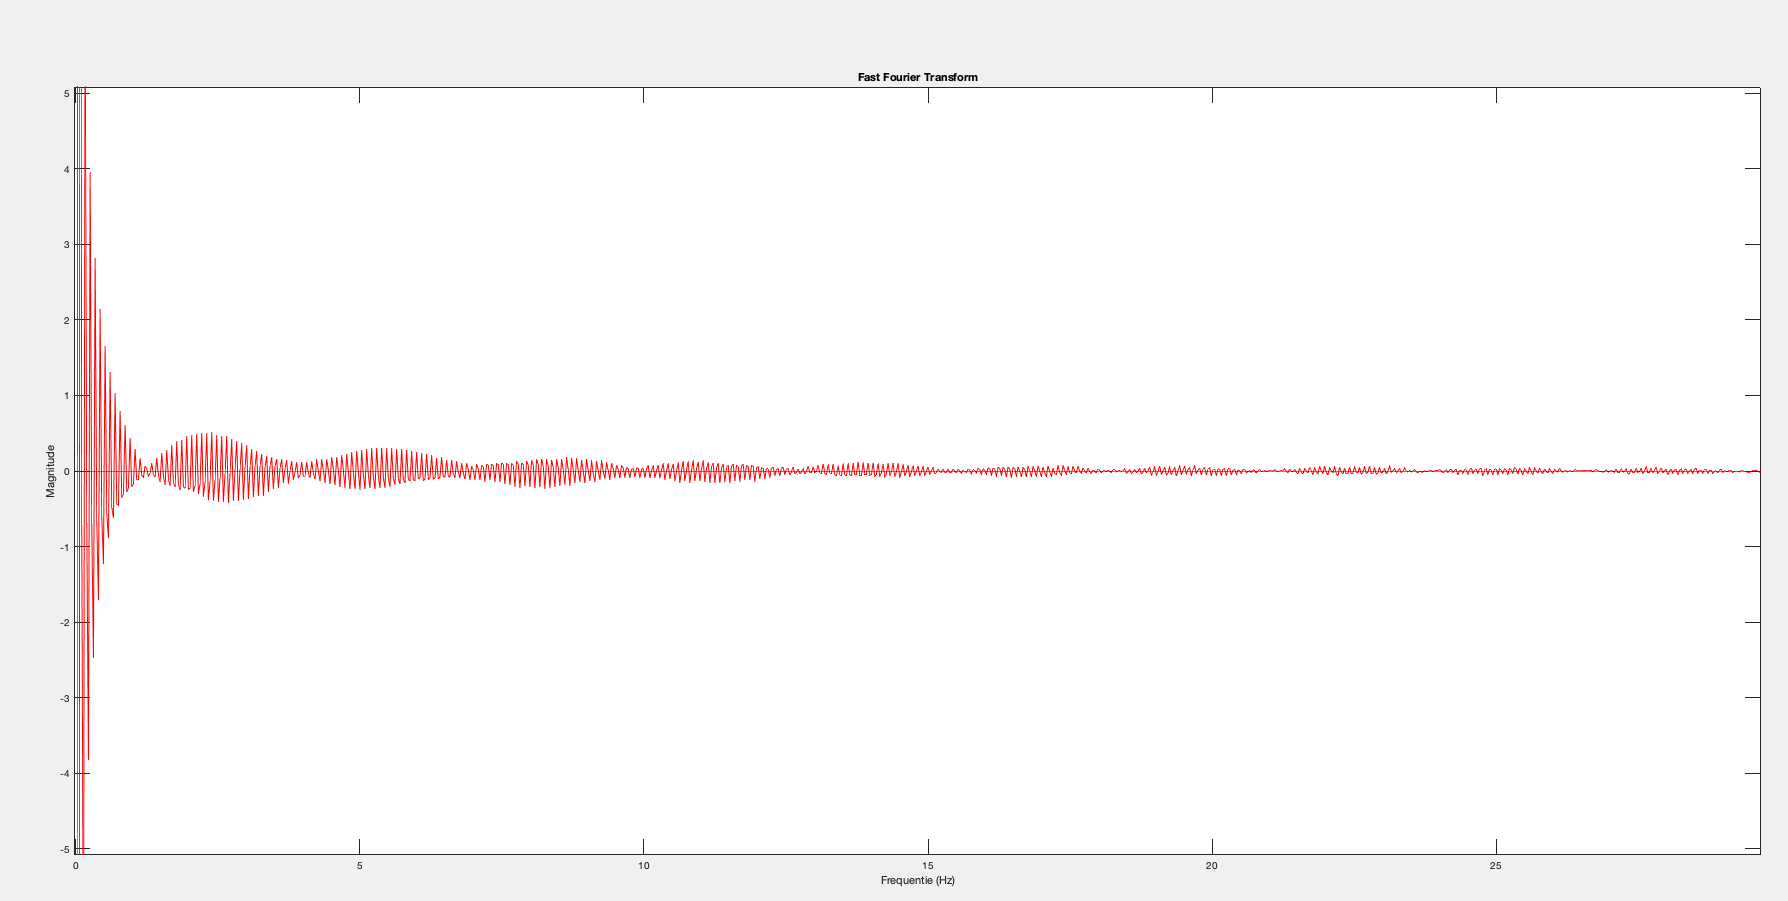
FFT (no absolute values): https://i.sstatic.net/qQTsX.png

The FFT seen in the image above is zoomed in on the frequency range 0-30Hz. The rest of the frequency range does not show a lot of (high) peaks, which probably are caused by noise.

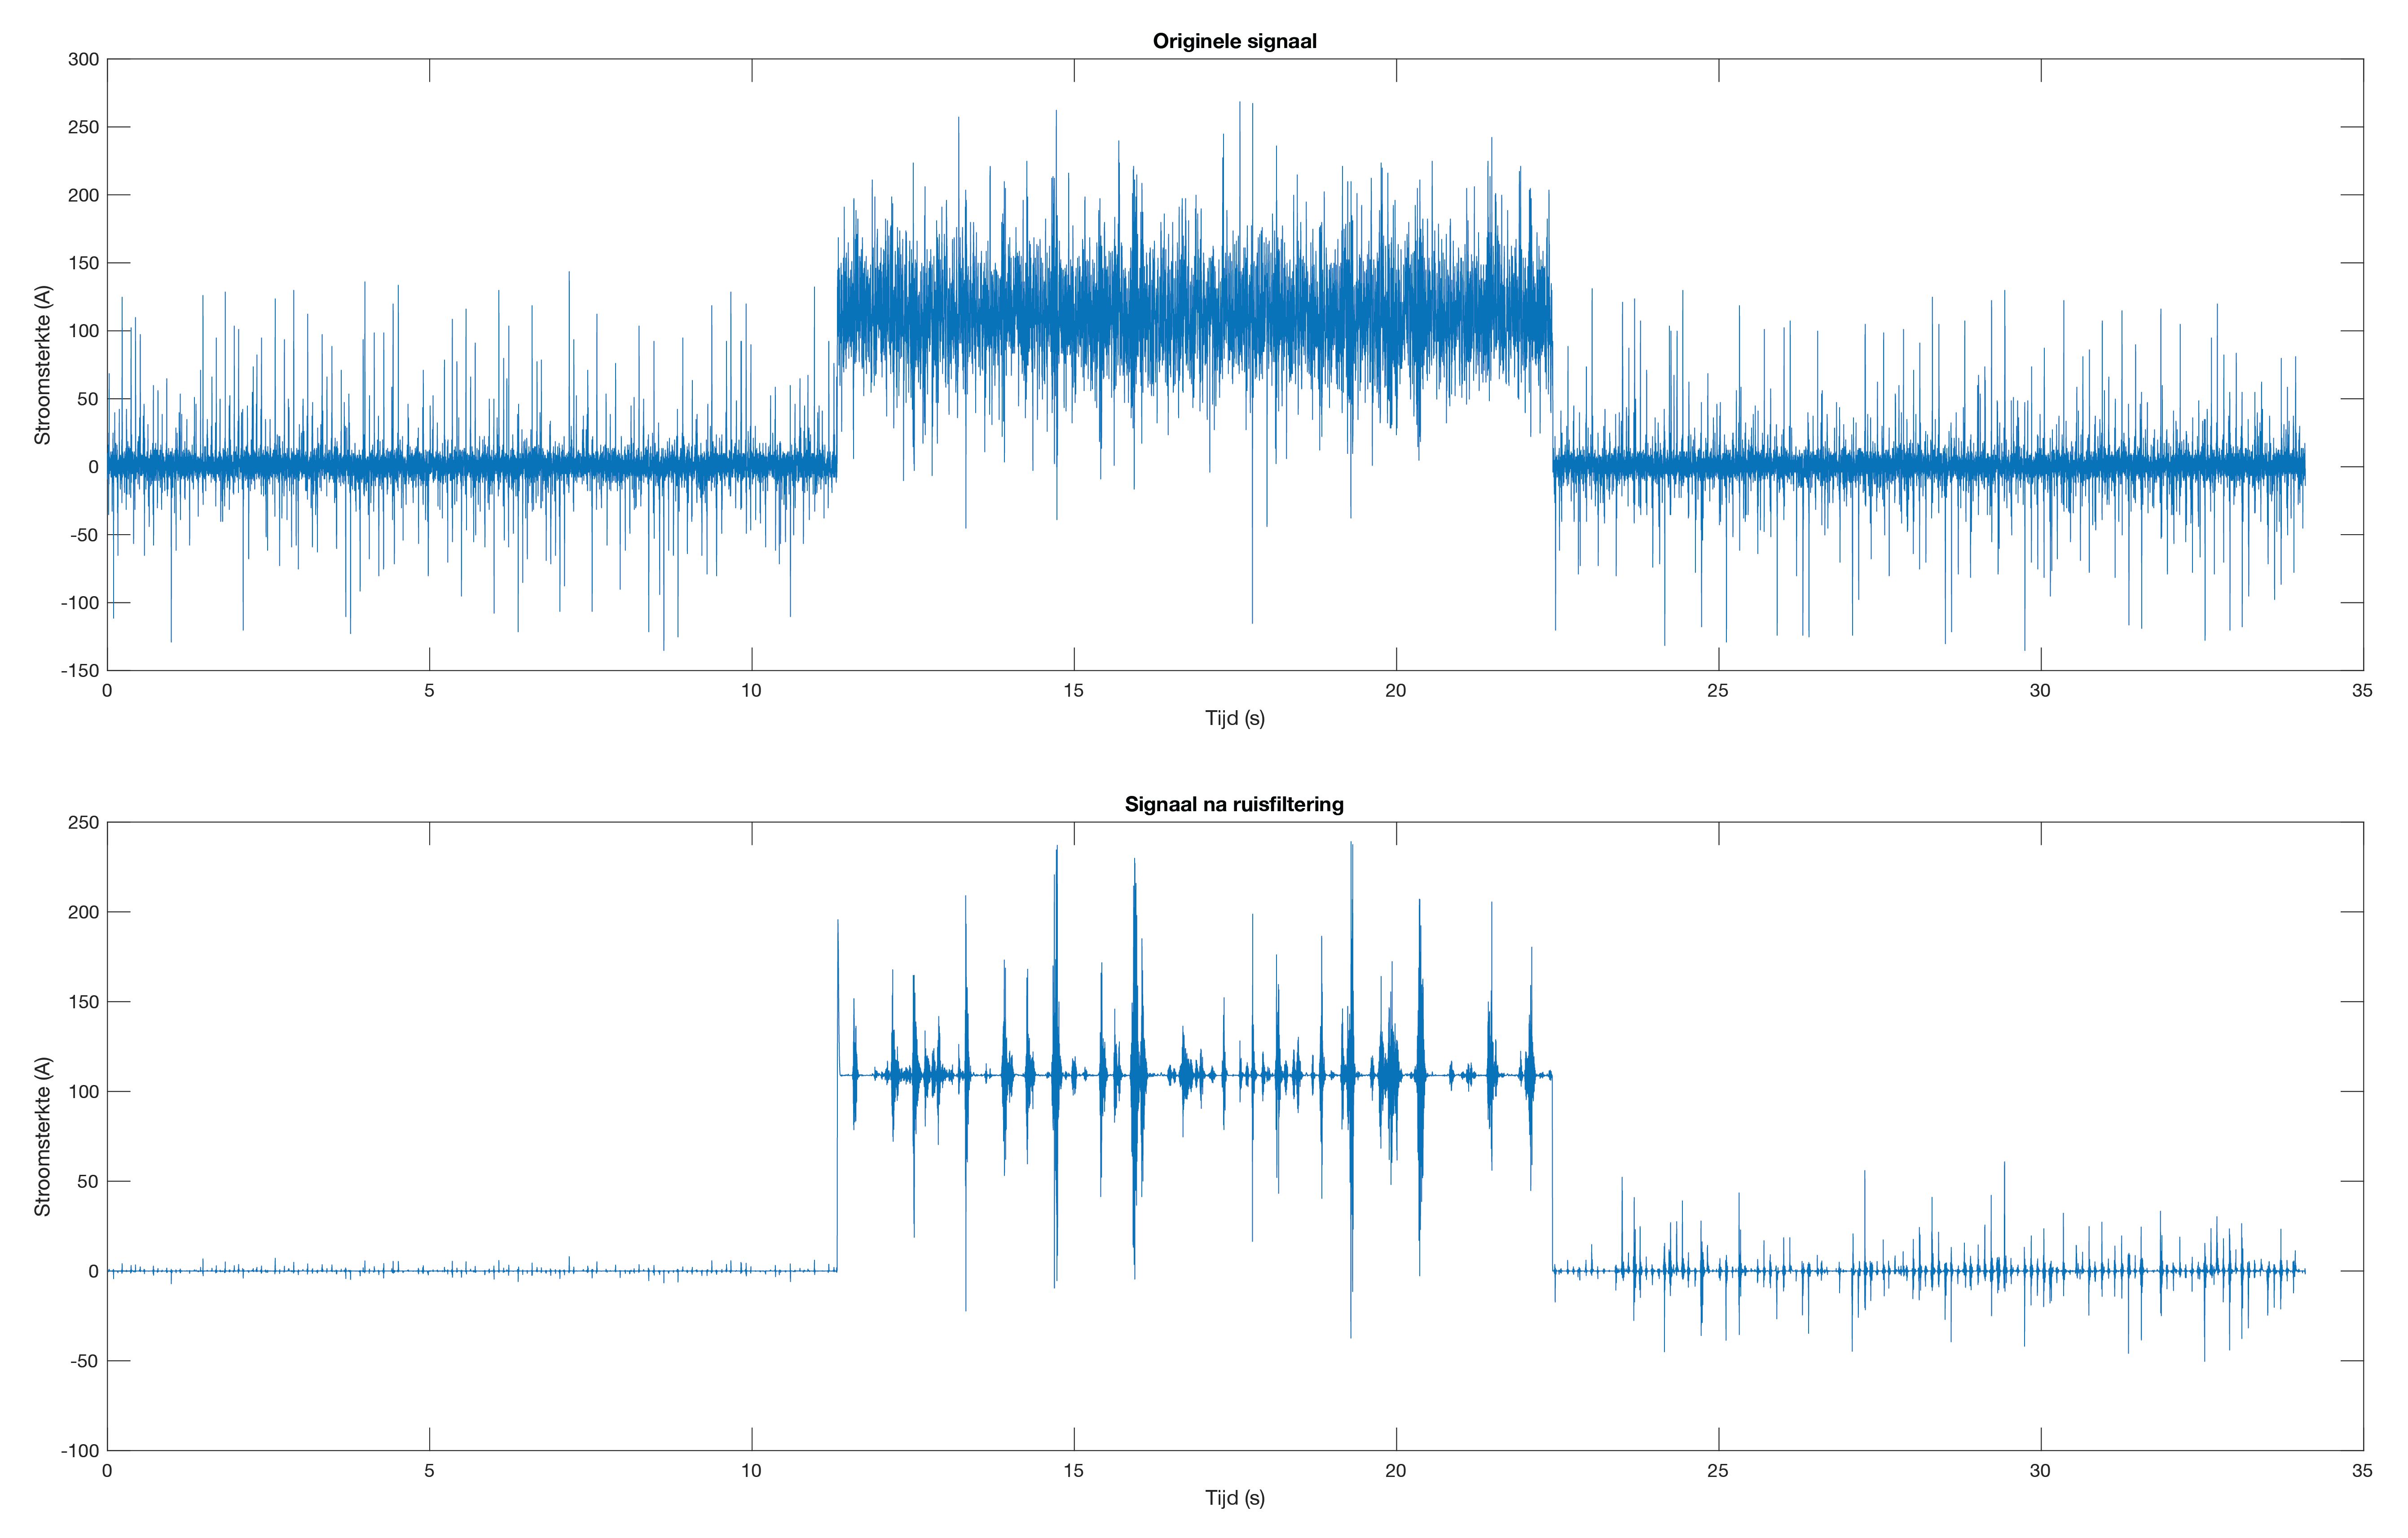
The signal is created during a method of welding, using an oscilloscope with a sampling frequency of 1000Hz. I've filtered the signal to remove noise, and after that the signal is converted to the frequency spectrum using the fft function of MATLAB.

Signal before and after filtering: enter image description here

My general question is, can the shown FFT be valid or did I make a mistake? I estimated the ground frequency to be around 5.5Hz, can I say this when I take one period of the big sinusoidal wave? I also noticed there are about 64 little sinusoidal waves inside one (ground??) period, is this an high harmonic wave form?.

If my theory is right, what causes the fft to be a damped sinusoidal form?

The code I use is basically the following. I leave the part of the noise filtering out because I don't think it's necessary for this question. The dataset is an matrix of 40100 rows.

fs = 1000;
cleanSignaal = data(:,4);
fftSignal = fft(cleanSignaal)/lenght(cleanSignaal);
f = fs/(2*length(fftSignal)):fs/length(fftSignal):fs;
plot(f,abs(fftSignal));
xlim([0 fs(m)/2]);
title('Fast Fourier Transform')
xlabel('Frequentie (Hz)')
ylabel('Magnitude')

I'm doing an assignment for the course Signal analysis where I have to analyse a signal. I've tried quite some things now but it's still bothering me that the FFT is looking weird, and not looks like the 'normal look' FFT's we learned in class.

FFT (absolute values of complex values): https://imgur.com/a/pYK3ENK
FFT (no absolute values): https://i.sstatic.net/qQTsX.png
The FFT seen in the image above is zoomed in on the frequency range 0-30Hz. The rest of the frequency range does not show a lot of (high) peaks, which probably are caused by noise.

The signal is created during a method of welding, using an oscilloscope with a sampling frequency of 1000Hz. I've filtered the signal to remove noise, and after that the signal is converted to the frequency spectrum using the fft function of MATLAB.

My general question is, can the shown FFT be valid or did I make a mistake? I estimated the ground frequency to be around 5.5Hz, can I say this when I take one period of the big sinusoidal wave? I also noticed there are about 64 little sinusoidal waves inside one (ground??) period, is this an high harmonic wave form?.

If my theory is right, what causes the fft to be a damped sinusoidal form?

The code I use is basically the following. I leave the part of the noise filtering out because I don't think it's necessary for this question. The dataset is an matrix of 40100 rows.

fs = 1000;
cleanSignaal = data(:,4);
fftSignal = fft(cleanSignaal)/lenght(cleanSignaal);
f = fs/(2*length(fftSignal)):fs/length(fftSignal):fs;
plot(f,abs(fftSignal));
xlim([0 fs(m)/2]);
title('Fast Fourier Transform')
xlabel('Frequentie (Hz)')
ylabel('Magnitude')

I'm doing an assignment for the course Signal analysis where I have to analyse a signal. I've tried quite some things now but it's still bothering me that the FFT is looking weird, and not looks like the 'normal look' FFT's we learned in class.

FFT (absolute values of complex values): enter image description here

FFT (no absolute values):

The FFT seen in the image above is zoomed in on the frequency range 0-30Hz. The rest of the frequency range does not show a lot of (high) peaks, which probably are caused by noise.

The signal is created during a method of welding, using an oscilloscope with a sampling frequency of 1000Hz. I've filtered the signal to remove noise, and after that the signal is converted to the frequency spectrum using the fft function of MATLAB.

Signal before and after filtering: enter image description here
My general question is, can the shown FFT be valid or did I make a mistake? I estimated the ground frequency to be around 5.5Hz, can I say this when I take one period of the big sinusoidal wave? I also noticed there are about 64 little sinusoidal waves inside one (ground??) period, is this an high harmonic wave form?.

If my theory is right, what causes the fft to be a damped sinusoidal form?

The code I use is basically the following. I leave the part of the noise filtering out because I don't think it's necessary for this question. The dataset is an matrix of 40100 rows.

fs = 1000;
cleanSignaal = data(:,4);
fftSignal = fft(cleanSignaal)/lenght(cleanSignaal);
f = fs/(2*length(fftSignal)):fs/length(fftSignal):fs;
plot(f,abs(fftSignal));
xlim([0 fs(m)/2]);
title('Fast Fourier Transform')
xlabel('Frequentie (Hz)')
ylabel('Magnitude')
added 488 characters in body
Source Link
user38162
user38162

I'm doing an assignment for the course Signal analysis where I have to analyse a signal. I've tried quite some things now but it's still bothering me that the FFT is looking weird, and not looks like the 'normal look' FFT's we learned in class.

FFT (absolute values of complex values): https://imgur.com/a/pYK3ENK FFT

FFT (no absolute values): https://i.sstatic.net/qQTsX.png

The FFT seen in the image above is zoomed in on the frequency range 0-30Hz. The rest of the frequency range does not show a lot of (high) peaks, which probably are caused by noise.

The signal is created during a method of welding, using an oscilloscope with a sampling frequency of 1000Hz. I've filtered the signal to remove noise, and after that the signal is converted to the frequency spectrum using the fft function of MATLAB.

My general question is, can the shown FFT be valid or did I make a mistake? I estimated the ground frequency to be around 5.5Hz, can I say this when I take one period of the big sinusoidal wave? I also noticed there are about 64 little sinusoidal waves inside one (ground??) period, is this an high harmonic wave form?.

If my theory is right, what causes the fft to be a damped sinusoidal form?

Thanks!The code I use is basically the following. I leave the part of the noise filtering out because I don't think it's necessary for this question. The dataset is an matrix of 40100 rows.

fs = 1000;
cleanSignaal = data(:,4);
fftSignal = fft(cleanSignaal)/lenght(cleanSignaal);
f = fs/(2*length(fftSignal)):fs/length(fftSignal):fs;
plot(f,abs(fftSignal));
xlim([0 fs(m)/2]);
title('Fast Fourier Transform')
xlabel('Frequentie (Hz)')
ylabel('Magnitude')

I'm doing an assignment for the course Signal analysis where I have to analyse a signal. I've tried quite some things now but it's still bothering me that the FFT is looking weird, and not looks like the 'normal look' FFT's we learned in class.

FFT (absolute values of complex values): https://imgur.com/a/pYK3ENK FFT (no absolute values): https://i.sstatic.net/qQTsX.png

The FFT seen in the image above is zoomed in on the frequency range 0-30Hz. The rest of the frequency range does not show a lot of (high) peaks, which probably are caused by noise.

The signal is created during a method of welding, using an oscilloscope with a sampling frequency of 1000Hz. I've filtered the signal to remove noise, and after that the signal is converted to the frequency spectrum using the fft function of MATLAB.

My general question is, can the shown FFT be valid or did I make a mistake? I estimated the ground frequency to be around 5.5Hz, can I say this when I take one period of the big sinusoidal wave? I also noticed there are about 64 little sinusoidal waves inside one (ground??) period, is this an high harmonic wave form?.

If my theory is right, what causes the fft to be a damped sinusoidal form?

Thanks!

I'm doing an assignment for the course Signal analysis where I have to analyse a signal. I've tried quite some things now but it's still bothering me that the FFT is looking weird, and not looks like the 'normal look' FFT's we learned in class.

FFT (absolute values of complex values): https://imgur.com/a/pYK3ENK

FFT (no absolute values): https://i.sstatic.net/qQTsX.png

The FFT seen in the image above is zoomed in on the frequency range 0-30Hz. The rest of the frequency range does not show a lot of (high) peaks, which probably are caused by noise.

The signal is created during a method of welding, using an oscilloscope with a sampling frequency of 1000Hz. I've filtered the signal to remove noise, and after that the signal is converted to the frequency spectrum using the fft function of MATLAB.

My general question is, can the shown FFT be valid or did I make a mistake? I estimated the ground frequency to be around 5.5Hz, can I say this when I take one period of the big sinusoidal wave? I also noticed there are about 64 little sinusoidal waves inside one (ground??) period, is this an high harmonic wave form?.

If my theory is right, what causes the fft to be a damped sinusoidal form?

The code I use is basically the following. I leave the part of the noise filtering out because I don't think it's necessary for this question. The dataset is an matrix of 40100 rows.

fs = 1000;
cleanSignaal = data(:,4);
fftSignal = fft(cleanSignaal)/lenght(cleanSignaal);
f = fs/(2*length(fftSignal)):fs/length(fftSignal):fs;
plot(f,abs(fftSignal));
xlim([0 fs(m)/2]);
title('Fast Fourier Transform')
xlabel('Frequentie (Hz)')
ylabel('Magnitude')
Source Link
user38162
user38162

Damped sinusoidal form FFT of signal

I'm doing an assignment for the course Signal analysis where I have to analyse a signal. I've tried quite some things now but it's still bothering me that the FFT is looking weird, and not looks like the 'normal look' FFT's we learned in class.

FFT (absolute values of complex values): https://imgur.com/a/pYK3ENK FFT (no absolute values): https://i.sstatic.net/qQTsX.png

The FFT seen in the image above is zoomed in on the frequency range 0-30Hz. The rest of the frequency range does not show a lot of (high) peaks, which probably are caused by noise.

The signal is created during a method of welding, using an oscilloscope with a sampling frequency of 1000Hz. I've filtered the signal to remove noise, and after that the signal is converted to the frequency spectrum using the fft function of MATLAB.

My general question is, can the shown FFT be valid or did I make a mistake? I estimated the ground frequency to be around 5.5Hz, can I say this when I take one period of the big sinusoidal wave? I also noticed there are about 64 little sinusoidal waves inside one (ground??) period, is this an high harmonic wave form?.

If my theory is right, what causes the fft to be a damped sinusoidal form?

Thanks!