The Hilbert Transform of an Amplitude Modulated signal returns the envelope of the signal. What does the Hilbert transform of a Frequency Modulated signal return? How can I use the Hilbert Transform to get the sidebands of a Frequency Modulated signal?
-
1$\begingroup$ Just a nitpick: a signal's envelope is the the amplitude (or absolute value) of its Hilbert transform. $\endgroup$– MBazCommented Oct 26, 2017 at 19:04
-
$\begingroup$ Yes, thanks. I am aware that the amplitude of the HT is the signal's envelope. What would be the equivalent for the FM signal though? Is it also the envelope of the signal? $\endgroup$– mipuraleCommented Oct 26, 2017 at 19:08
-
1$\begingroup$ Yes, it's always the envelope -- the HT "doesn't care" how the signal was modulated. Keep in mind that you can also use the phase, though. $\endgroup$– MBazCommented Oct 26, 2017 at 20:45
1 Answer
From this great answer . .
If we have a real-valued sequence x(n)x(n), and the Hilbert transform of x(n)x(n) is xH(n)xH(n), the analytic signal, a(n)a(n), associated with x(n)x(n) is:
a(n)=x(n)+jxH(n)
Computing the magnitude of a(n)a(n) will give you the instantaneous envelope of the original x(n)x(n) sequence. This works great for AM demodulation. If you compute the instantaneous phase of a(n)a(n) to get ϕ(n)ϕ(n), and compute the time derivative of ϕ(n)ϕ(n), you have FM demodulation.
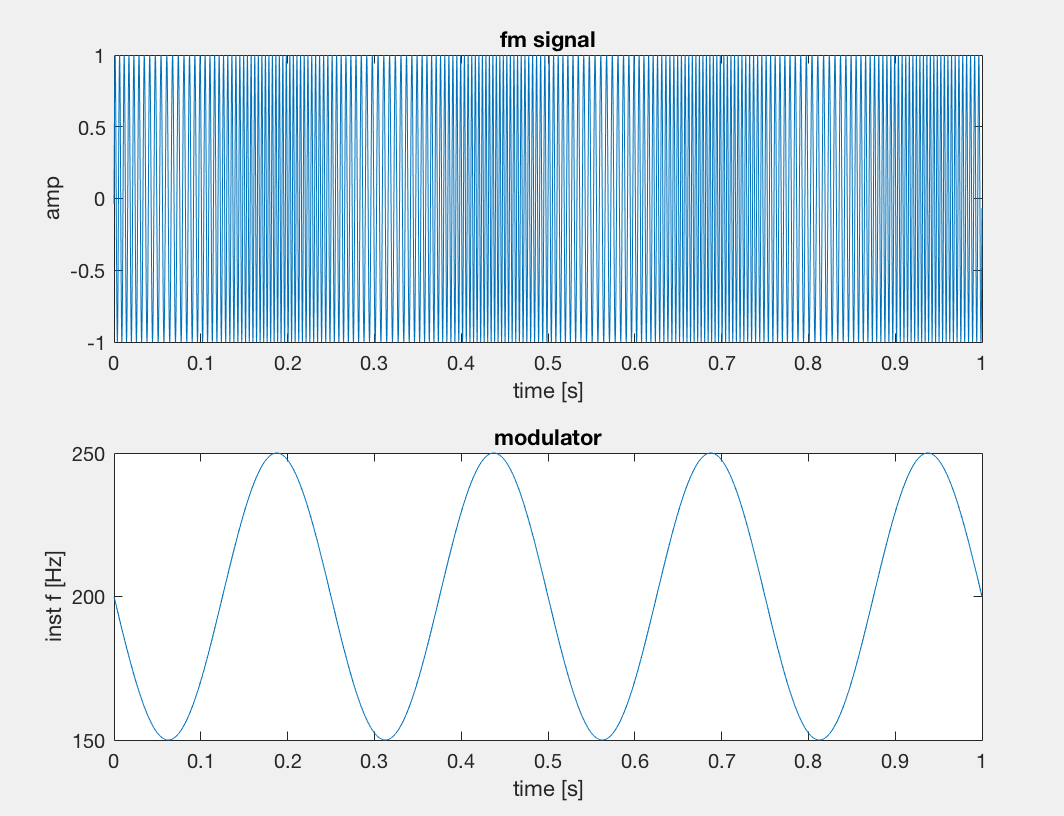
A practical example where we generate an FM signal in Matlab and analyse it looks as follows:
fs = 44.1e3; %// sample rate
dt = 1/fs;
fc = 200; %// carrier
df = 50; %// modulation excursion (Hz)
fm = 4; %// modulation rate (Hz)

tAx = dt:dt:1; %// time axis in seconds
u = sin(2*pi*fc*tAx + (df/fm)*cos(2*pi*fm*tAx));
w = unwrap(angle(hilbert(u)));
v = diff(w)/(2*pi*dt); %// instantaneous phase differential normalized to Hz
Plotting u and v then gives the following plot, where the sidebands occur at the extremes of the signal . .

