1
$\begingroup$

I generated an signal with a base frequency of $50\textrm{ Hz}$ and its harmonics and quantization noise in it (as an array in MATLAB). It's sampled fast enough to make sure there is no aliasing etc.

I calculate the PSD with a rectangular window in MATLAB. Due to the fact that the signal is synthesized in MATLAB I know where my harmonics are, so I chose length of my FFT to have a frequency resolution of $5\textrm{ Hz}$. I did this to be able to see my hamonics without the spectral leakage effect.

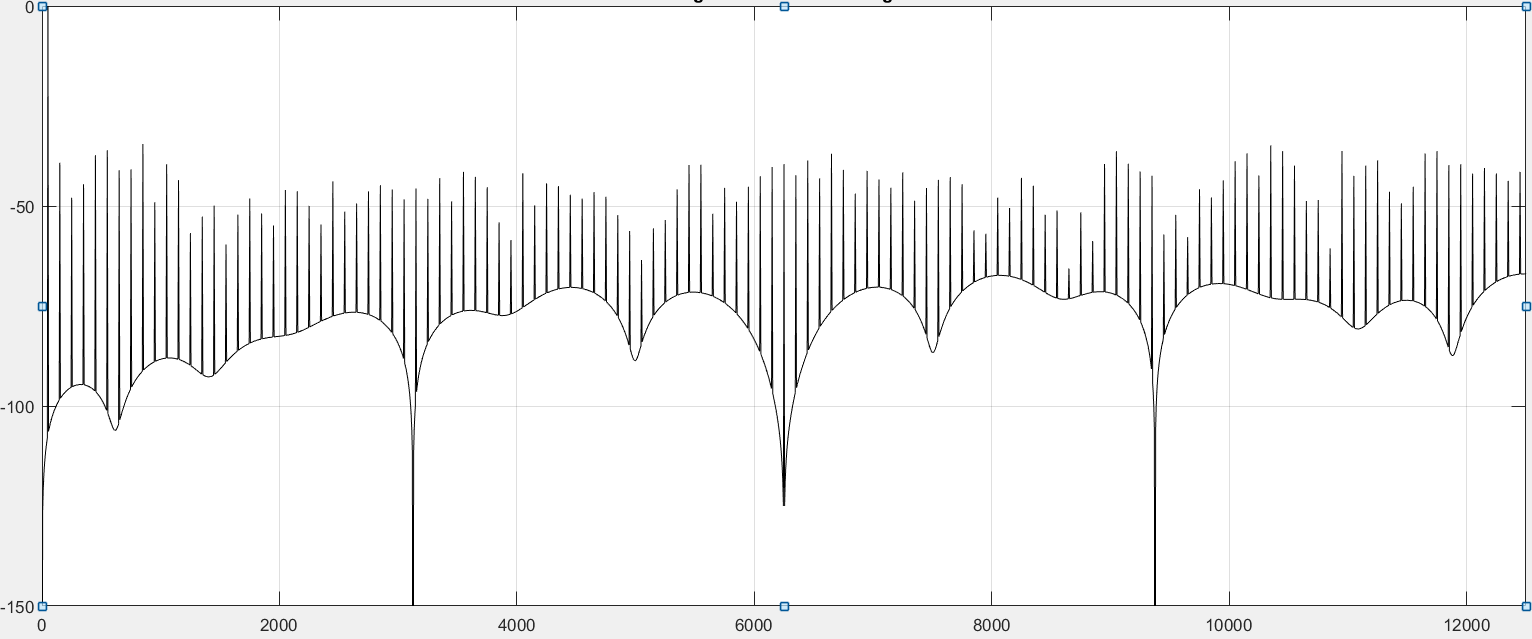
My problem is, that the PSD estimates differ from my expectations. I expected to see spikes caused by my harmonics and a kind of random noise floor. But what I get is kind of a continuous looking PSD with spikes as you can see in the image below:

weird PSD

The $x$-axis is the frequency in $\textrm{Hz}$ and the $y$-axis is in $\textrm{dBc/Hz}$ normalised to my base frequency power.

My Matlab code is:

NFFT = length(bitstream)-1; %df = fs / NFFT = 5 Hz
fVals = fs*(0:NFFT/2)/NFFT;

% calc fft
X_f = abs(fft(bitstream,NFFT));
% calculate periodogram (one sided)
pxx = ((X_f(1:NFFT/2+1))/NFFT).^2;
% plot
plot(fVals,10*log10(pxx/max(pxx)),'black');

The MATLAB function periodogram() as shown below (with rectangular window and same FFT length) produces the same output, so I thought my code is correct.

pxx = periodogram(bitstream,rectwin(length(bitstream)),NFFT);
  • Can you tell my why I see that?
  • Is the periodogram method not suitable for that case?
  • Is it caused by the rectangular window and/or the frequency resolution? If I use the built-in non-parametric estimation functions like pwelch(), periodogram(), pmtm() etc. without any further input it looks more noisy (as expected).
  • Or is it even better than expected because one of the frequencies in my simulation is the greatest common divider of the sampling frequency (using e.g. a signal with a different frequency like $49\textrm{ Hz}$ also leads to more noisy results)?
$\endgroup$

1 Answer 1

2
$\begingroup$

I believe this is due to your choice of using a rectangular window, which has the best frequency resolution (1 bin) but worst spectral leakage (dynamic range). The spectral leakage is of the form of a $\textrm{sinc}$ function (with nulls at $1/T$ where $T$ is your window length in time), which has an envelope that rolls off very slowly ($1/f$) in frequency. What I believe you see above is the cumulative effect of the $\textrm{sinc}$ function in frequency due to your window convolving with each tone.

My favorite window choice is the Kaiser window kaiser(N,beta), as you can control the precision and dynamic range trade directly through the use of beta. Beta factors I typically use range from 4 to 12 but you can experiment with it and see what works best for you.

Try this to see the window performance (MATLAB / Octave) in the frequency domain (showing the main lobe width (precision) and sidelobe level (dynamic range).

wind = kaiser(N, beta)
freqz(wind)
$\endgroup$
4
  • $\begingroup$ In the figure above, I just displayed the content of one "hump" of the Sinc curve, so that shouldn't be the case. My system is basically a digital System running at $25 \textrm{kHz}$ and it is sampled for the FFT with $100 \cdot 25 \textrm{kHz}$ to make sure there is no aliasing. I am only interested in the PSD of the low frequency part. $\endgroup$
    – c-a
    Commented Jun 15, 2016 at 14:10
  • $\begingroup$ I am not sure I follow what you are saying - did you try multiplying your time sequence by the window I suggested prior to taking the FFT? This will reduce the "floor" between the spikes given the spikes are your actual frequencies that exist. $\endgroup$ Commented Jun 15, 2016 at 14:13
  • $\begingroup$ Sorry for my late reply. It just added noise to the spectrum above. That's not what I want. The spectrum of a signal is a continuous function...so I think I was just lucky picking my frequency resolution in a way that every frequency in that synthesized signal is sitting just on top of one of my sampling points, so there is no noise. Do you think that's a viable explanation? $\endgroup$
    – c-a
    Commented Jun 21, 2016 at 6:24
  • $\begingroup$ Yes if you sample in such a way (integer multiple of your frequency) in such a way that your signal "circularly repeats" meaning rotating around from the last sample to the first sample has no discontinuity, or another view repeating your waveform sample one after another and seeing that as the waveform ends and then continues to the start with no discontinuity, then you will not have any spectral leakage effect. This approach is fine for a sinusoidal fixed frequency and integer harmonics of it, but will be a challenge for other waveforms (unless repeats via the greatest common multiple) $\endgroup$ Commented Jun 23, 2016 at 11:44

Your Answer

By clicking “Post Your Answer”, you agree to our terms of service and acknowledge you have read our privacy policy.

Not the answer you're looking for? Browse other questions tagged or ask your own question.