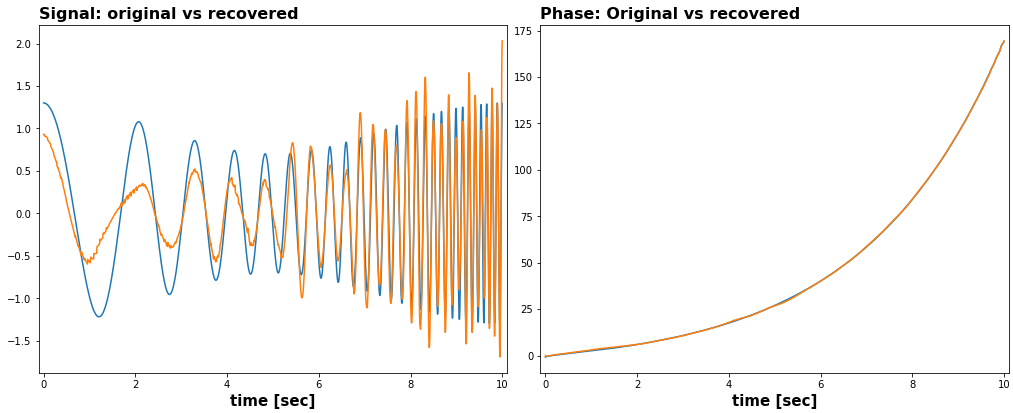
I am trying to find the phase of my dataset between a range of frequencies. I can't post my code or data but generally speaking, the frequencies range from 10 to 100kHz and I need the phase between 20 and 30kHz.
The data is read into Python as real numbers in the form of 64-bit floats. I was thinking to first pass the data through a spectrogram and set the mode to angle or phase. My first question is, I see from the scipy documentation the difference between the angle and phase modes is the wrapping. I'm not sure which to use so what do I need to consider when choosing one?
Second, how should I choose the parameters of the spectrogram to get the correct phase i.e. how should I choose the overlap number, fft length and window?
Lastly, once I have the complex angle returned by the spectrogram function, what operations do I need to do to recover the phase in degrees? Or, is there a better way to do this that does not use the spectrogram function?
Thank you


spectrogram = abs(stft). If not, the problem is much more challenging. If yes, then "spectrogram" should be changed to "STFT" everywhere in the question. $\endgroup$