- I am generating 2 sine waves, first one has fundamental frequency = 50 Hz, amplitude=10, phase=0, the second one has fundamental frequency = 100 Hz, amplitude = 5 and phase = np.pi/6 (which is 30degrees).
- Then I add them up, and perform FFT on the added signal.
- I calculate the magnitude of the signals at 50 Hz and 100 Hz using np.abs()
- I calculate the phase of the signal at 50 Hz and 100 Hz respectively using np.angle()
- This is the result I get
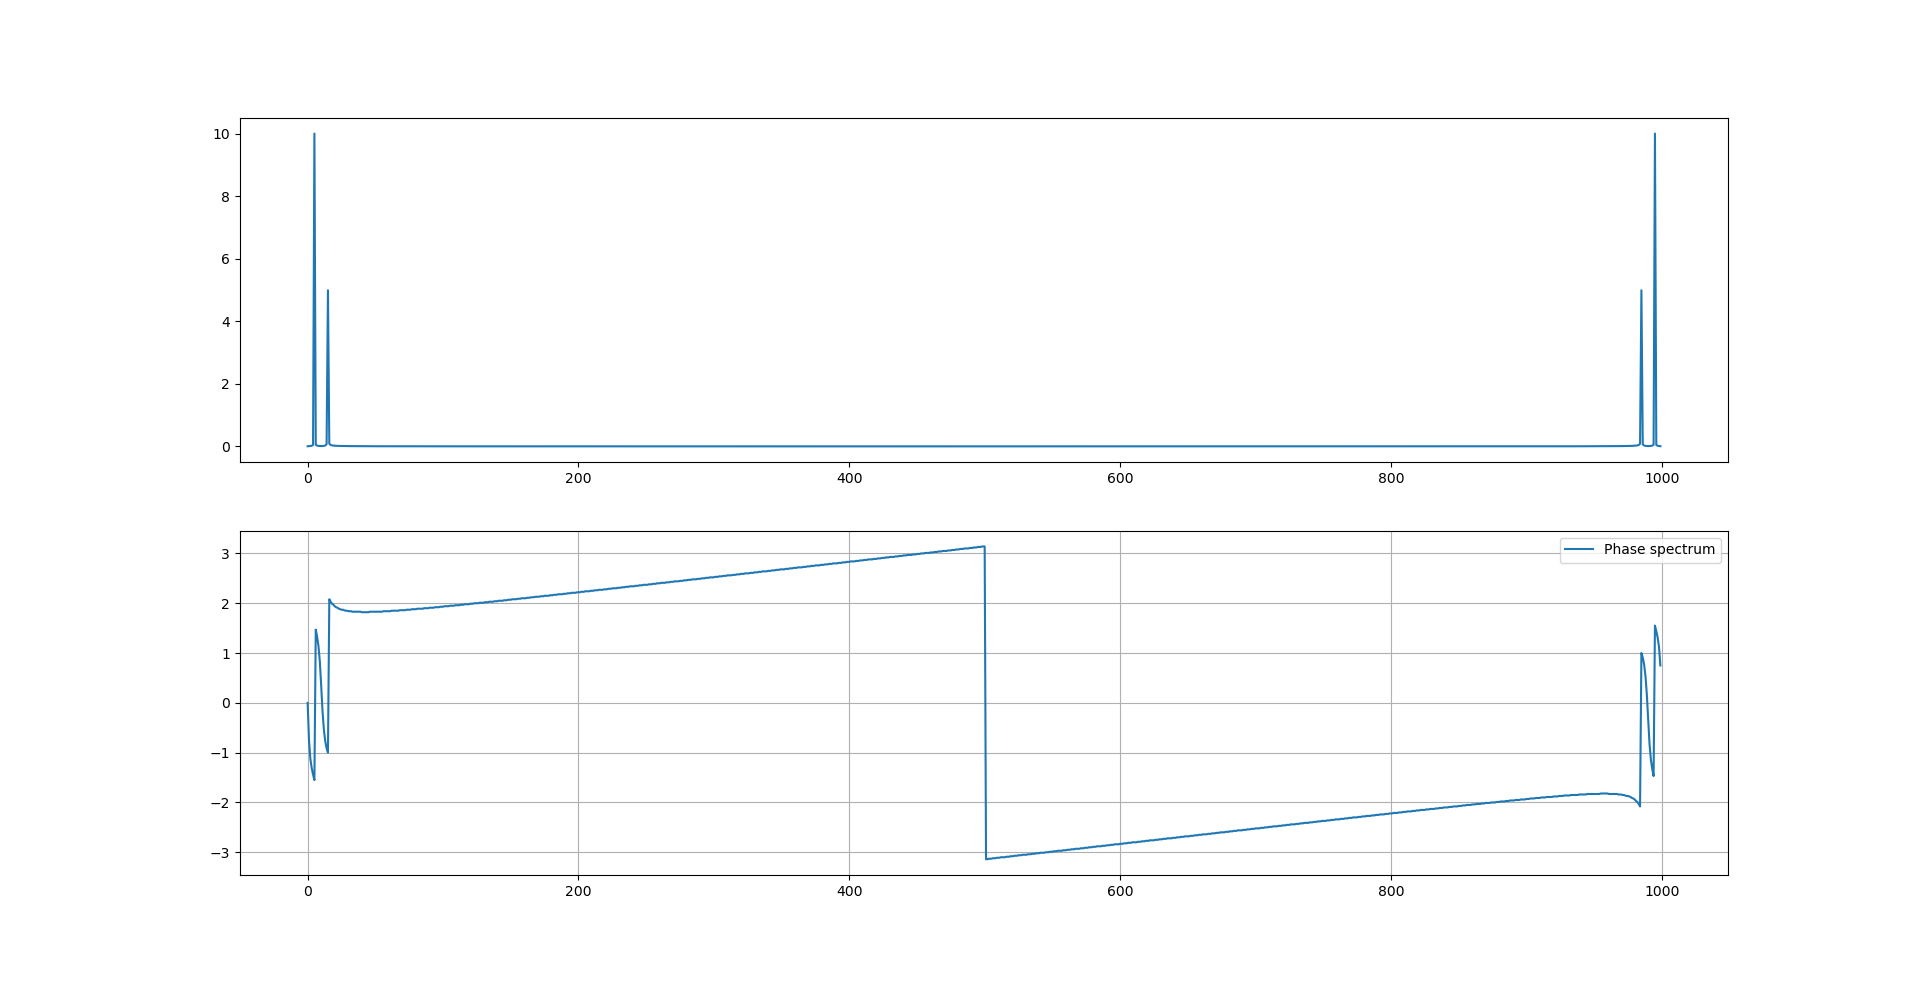
'magnitude_50 Hz': 9.997827675356993, 'phase_50 HZ': -89.0677734968239, 'magnitude_150 Hz': 4.990392258900833, 'phase_150 HZ': -57.231981462145704,
The magnitude returned is quite close to 10 and 5 respectively. But the phase is not 0 and 30 degrees.
I tried other methods like the math.atan2 and cmath.phase also and it provides similar results.
I would like to understand what is wrong with my phase calculation. My code is below.
def sine_wave(amplitude1: Union[int, float], amplitude2: Union[int, float], phase1: float, phase2: float,
          duration: Union[int, float],fund_freq_1: int, fund_freq_2: int, samp_freq: int) -> dict:


# generating the time domain signal

t = np.linspace(0, duration, int(samp_freq * duration))
wave1 = amplitude1 * np.sin((2 * np.pi * fund_freq_1 * t)+phase1)
wave2 = amplitude2 * np.sin((2 * np.pi * fund_freq_2 * t)+phase2)
combined_wave = np.add(wave1, wave2)
N = combined_wave.size
T = 1/samp_freq

# DFT
f = np.fft.fftfreq(N, 1 / samp_freq)
fft = np.fft.fft(combined_wave)

index_one = np.where(np.isclose(f, fund_freq_1))
magnitude_one = np.mean(np.abs(fft[index_one]) * (2 / N))
phase_one = degrees(np.angle(fft[index_one]))
# phase_one = atan2(fft[index_one].imag, fft[index_one].real)
# phase_one = degrees(phase(fft[index_one]))

index_two = np.where(np.isclose(f, fund_freq_2))
magnitude_two = np.mean(np.abs(fft[index_two]) * (2 / N))
phase_two = degrees(np.angle(fft[index_two]))
# phase_two = atan2(fft[index_two].imag, fft[index_one].real)
# phase_two = degrees(phase(fft[index_two]))

return {'magnitude_{} Hz'.format(fund_freq_1): magnitude_one,
        'phase_{} HZ'.format(fund_freq_1): phase_one,
        'magnitude_{} Hz'.format(fund_freq_2): magnitude_two,
        'phase_{} HZ'.format(fund_freq_2): phase_two}
The code could be run like this
sine_wave(amplitude1=10, amplitude2=5, phase1=0, phase2=np.pi/6, duration=0.1, fund_freq_1=50, fund_freq_2=150, samp_freq=10000)
Plotted the amplitude and phase also

Further doubt
Similar to what I've disucssed yesterday I am working on another problem at work.
In order to solve that I'm creating test sine waves (N=2000 samples or data points) and performing the same procedure on these sine waves.
*** first wave = fundamental frequency = 50, sampling frequency = 10000, duration = 0.2, amplitude = 10, phase = 0 degrees
- second wave = fundamental frequency = 50, sampling frequency = 10000, duration = 0.2, amplitude = 10, phase = 120 degrees
- third wave = fundamental frequency = 50, sampling frequency = 10000, duration = 0.2, amplitude = 10, phase = 240 degrees**
I generate the waves using this function.
def generate_test(amplitude1: Union[int, float], amplitude2: Union[int, float], amplitude3: Union[int, float],
                  phase1: float, phase2: float, phase3: float, duration: Union[int, float], fund_freq_1: int,
                  fund_freq_2: int, fund_freq_3: int, samp_freq: int) -> tuple:
    """
    :param amplitude1: Amplitude of the first sine wave
    :param amplitude2: Amplitude of the second sine wave
    :param amplitude3: Amplitude of the third sine wave
    :param phase1: Phase of the first sine wave in radians
    :param phase2: Phase of the second sine wave in radians
    :param phase3: Phase of the third sine wave in radians
    :param duration: Duration of each sine waves
    :param fund_freq_1: Fundamental frequency the first sine wave
    :param fund_freq_2: Fundamental frequency the second sine wave
    :param fund_freq_3: Fundamental frequency the third sine wave
    :param samp_freq: Sampling frequency of each sine waves
    :return: 3 sines waves
    :rtype: tuple of 3 numpy arrays
    """
    t = np.arange(0, duration * samp_freq) / samp_freq
    wave1 = amplitude1 * np.sin((2 * np.pi * fund_freq_1 * t) + phase1)
    wave2 = amplitude2 * np.sin((2 * np.pi * fund_freq_2 * t) + phase2)
    wave3 = amplitude3 * np.sin((2 * np.pi * fund_freq_3 * t) + phase3)

    return wave1, wave2, wave3
Main task:
1. Generate 3 sine waves using the 'generate_test' function. Each with 120 degrees phase shift
    * first wave = fundamental frequency = 50, sampling frequency = 10000, duration = 0.2,  amplitude = 10, phase = 0 degrees
    * second wave = fundamental frequency = 50, sampling frequency = 10000, duration = 0.2, amplitude = 10, phase = 120 degrees
    * third wave = fundamental frequency = 50, sampling frequency = 10000, duration = 0.2, amplitude = 10, phase = 240 degrees
2. I divide each wave into exactly two halves, let's call these halves as the before half and after half. (2000 samples or data points divided into two signals with 1000 data points each)
2. From each of the halves I drop the first and last 50 data points (50 (first fifty) + 50 (last fifty) = 100)
3. Now i have 3 before halves and 3 after halves
4. From each of the 3 before and 3 after halves I need to calculate the amplitude and phase at 50 Hz using FFT .
5. Calculate FFT
6. Find indices corresponding to 50 Hz. I get 2 indices here, because the frequency bins are not centered at 50 Hz
7. Use np.abs to calculate the absolute value of the FFT component then take a mean of it
8. Use np.angle to calculate the phase of the FFT component, convert it to degrees and then take the mean of it.
The code is given below
def test_amplitude_phase_algo(amplitude1: Union[int, float], amplitude2: Union[int, float],
                              amplitude3: Union[int, float],
                              phase1: float, phase2: float, phase3: float, duration: Union[int, float],
                              fund_freq_1: int,
                              fund_freq_2: int, fund_freq_3: int, samp_freq: int):

    test_data = plot_and_return(amplitude1, amplitude2, amplitude3, phase1, phase2, phase3, duration, fund_freq_1,
                                fund_freq_2, fund_freq_3, samp_freq)
    T = 1 / samp_freq
    result_df = pd.DataFrame()

    for col in test_data.columns:
        prevail = test_data[col][50:950]
        trail = test_data[col][1050:1950]

        N = prevail.size

        # Prevailing samples
        prevail_frequencies = np.fft.fftfreq(N, 1 / samp_freq)
        prevail_fft = np.fft.fft(prevail)
        prevail_index = np.where(np.isclose(prevail_frequencies, 50, atol=1 / (T * N)))

        prevail_amplitude = np.mean(np.abs(prevail_fft[prevail_index]) * (2 / N))
        prevail_phase = degrees(np.mean(np.angle(prevail_fft[prevail_index])))

        # Trailing samples
        trailing_frequencies = np.fft.fftfreq(N, 1 / samp_freq)
        trailing_fft = np.fft.fft(trail)
        trail_index = list(np.where(np.isclose(trailing_frequencies, 50, atol=1 / (T * N)))[0])

        trail_amplitude = np.mean(np.abs(trailing_fft[trail_index]) * (2 / N))
        trail_phase = degrees(np.mean(np.angle(trailing_fft[trail_index])))

        result_array = np.array((prevail_amplitude, trail_amplitude, prevail_phase, trail_phase))
        temp_df = pd.DataFrame(result_array).T
        result_df = result_df.append(temp_df)

    i0 = result_df.mean(axis=0)
    result_df = result_df.append(i0, ignore_index=True)
    result_df.columns = ['amplitude_before', 'amplitude_after', 'phase_before', 'phase_after']
    result_df.index = ['w1', 'w2', 'w3', 'avg_w']

    return result_df
This is the answer I get:
    amplitude_before  amplitude_after  phase_before  phase_after
w1          6.346514         6.346514     -0.011246    -0.011246
w2          6.383717         6.383717    -60.070936   -60.070936
w3          6.383184         6.383184     60.082026    60.082026
avg_w       6.371139         6.371139     -0.000052    -0.000052
My question is only concerning the measured phase of the signals (I will come to amplitudes in a different question).
As mentioned in the answers yesterday, my angle should be off by -90 degrees. If I add 90 degrees to the resultant angles then my angles will be
    phase_before  phase_after
w1      ~90             ~90
w2      ~30             ~30
W3      ~150            ~150
avg_w   ~90             ~90
The phases should be
    phase_before  phase_after
w1      ~0              ~0
w2      ~120            ~120
W3      ~240            ~240
avg_w   ~120            ~120


