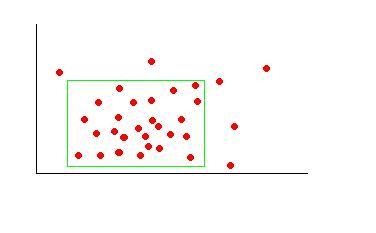
First of all, I donot think you described your problem properly, because you might find multiple 'boxes' containing 80% of points. I call your box of interest as BOI in the rest of my post.
I've no idea what you gonna to do with this BOI, but I guess you are trying to do some data visualization or find criteria to differentiate outliners. There are many more professional ways to visualize scatter data points within a certain confidence interval.
In short, these algorithms normally do the following things
1) estimate the statistics of the given sample data, eg. mean and standard deviation
2) compute the confidence interval of a certain level, according to your prescribed data distribution or estimated distribution
3) plot the contours of the found confidence interval on the scatter plot
Although the rectangular region of a confidence interval sounds simple, it is clearly less accurate than than other shapes, e.g. a eclipse used in guassian distributed data. So if you are writing a scientific report, please follow these existing methods.
In case you insist to find the BOI, you can following the similar steps with additional considerations on defining the best BOI of all found BOIs. Why? Because you shall see multiple BOIs that containing 80% of data points. To be frank, finding the best BOI is a task that is more difficult then it looks like. However, several things are clear here:
1) the mean point of the data set should be in the best BOI
2) we should define what is your best BOI (I think the BOI with the minimum variance should be the best)
The following described method is actually something like the histogram analysis. To find the best BOI, you shall put your data points into bins, and allows us to compute histogram later. Note the bin width defines the resolution of our method. If it is too big, for example, as wide as your data point span, then you will never find a so-call 80% BOI. If it is tot small, for example, the finite precision of your machine, then you might take hours to find the best BOI. In general, simply pick something moderate is OK (or you can implement adaptive methods to pick the width and height of the bin for you data).
Assume you pick the bin size. Then you simply compute the histogram of your data $T=\textrm{Hist}(Data|bin)$, where each bin contains an integer number of points. You should have a 2D histogram if your data is 2D. Once you get this histogram, retrieve its height $h$ and width $w$, then do the following things, you shall find the unique BOI defined as the quadruple of $(x,y,W,H)$, where $x,y$ defines the upper-left point of the $W\times H$ BOI.
- Construct the integral image of this histogram
$\textrm{II}(T)$(how to do? see details in wiki. This fast method
will allow you to compute the number of points within an arbitrary
BOI for only three operations.)
- Initialize $v_{min} = realmax$
- For each possible BOI size $W\times H$, you retrieve the number of data points of $W\times H$ BOI from $\textrm{II}(T)$
- Eliminate all candidate BOIs without the mean point
- Eliminate all candidate BOIs with less than 80% points
- Compute the variance of data points within each candidate BOI
- Find the BOI with the minimum variance as $v$ of size $W\times H$
- If $v<v_{min}$, then update $v_{min}=v$ and record the quadruple of this BOI.
- Repeat step 3-8 until you search all possible sizes
In the end, this should give you a unique BOI with the minimum variance. Depending on the number of data points and the bin size, you might expect the above algorithm takes a reasonable long time to get your the best BOI.

