1
$\begingroup$

I've got an array of different values representing the y-values in a plot:

y-values = [0.07, 0.09, 0.04, 0.15, 0.14, 0.05, 0.02, 0.2, 0.18,...  ...0.06, 0.2, 0.17, 0.19, 0.21, 0.3]

I want to split it in 3 intervals:

  • the first one should return the values to the first big amplitude (here: [0.07, 0.09, 0.04, 0.15])

  • the second one should return the values to the last big amplitude (here: [0.14, 0.05, 0.02, 0.2, 0.18,... ...0.06, 0.2])

  • the last one should contain the last values (here: [0.17, 0.19, 0.21, 0.3])

I have no idea how to calculate these threshold-amplitudes. Can anyone help me with this problem?

I have to implement this. I originally posted it on StackOverflow, but this is too mathematical as a programming subject, hope I can get some help here.
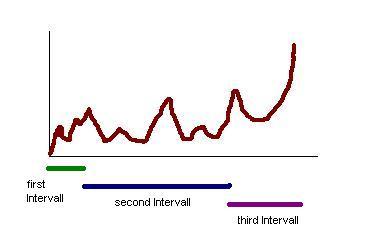
enter image description here

$\endgroup$
1

1 Answer 1

1
$\begingroup$

You have to be specific about your selection criteria. All you're "big amplitude" are local maxima but there are also other local maxima that don't qualify (why?). It looks like you want a local maximum that's above a certain threshold. Or maybe you only want the top 3? Anyway, you can find local maxima by either differentiating and finding the zeros or my a simple search by looking at the neighbors of each sample. Then this can be combined with a threshold detector or a sorting algorithm.

$\endgroup$

Your Answer

By clicking “Post Your Answer”, you agree to our terms of service and acknowledge you have read our privacy policy.

Not the answer you're looking for? Browse other questions tagged or ask your own question.