4
$\begingroup$

I have the following one-dimensional signals:

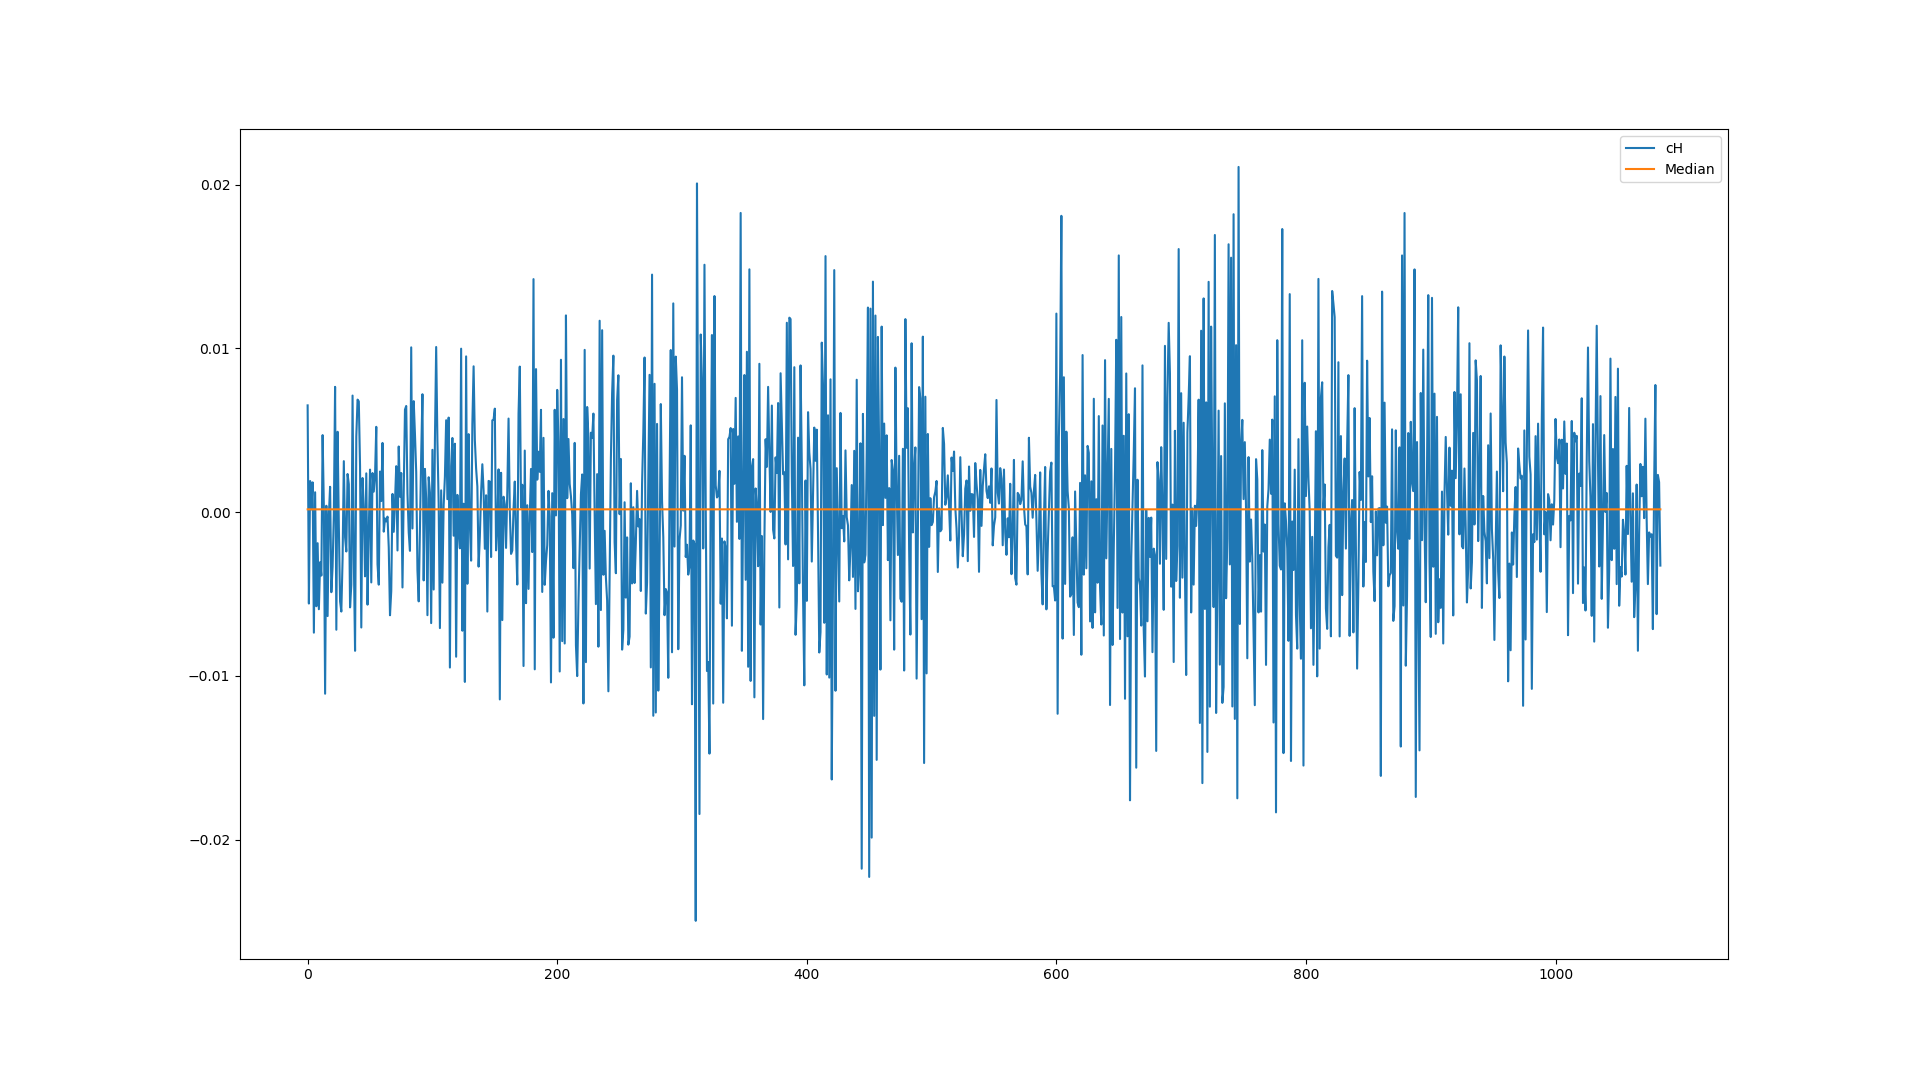
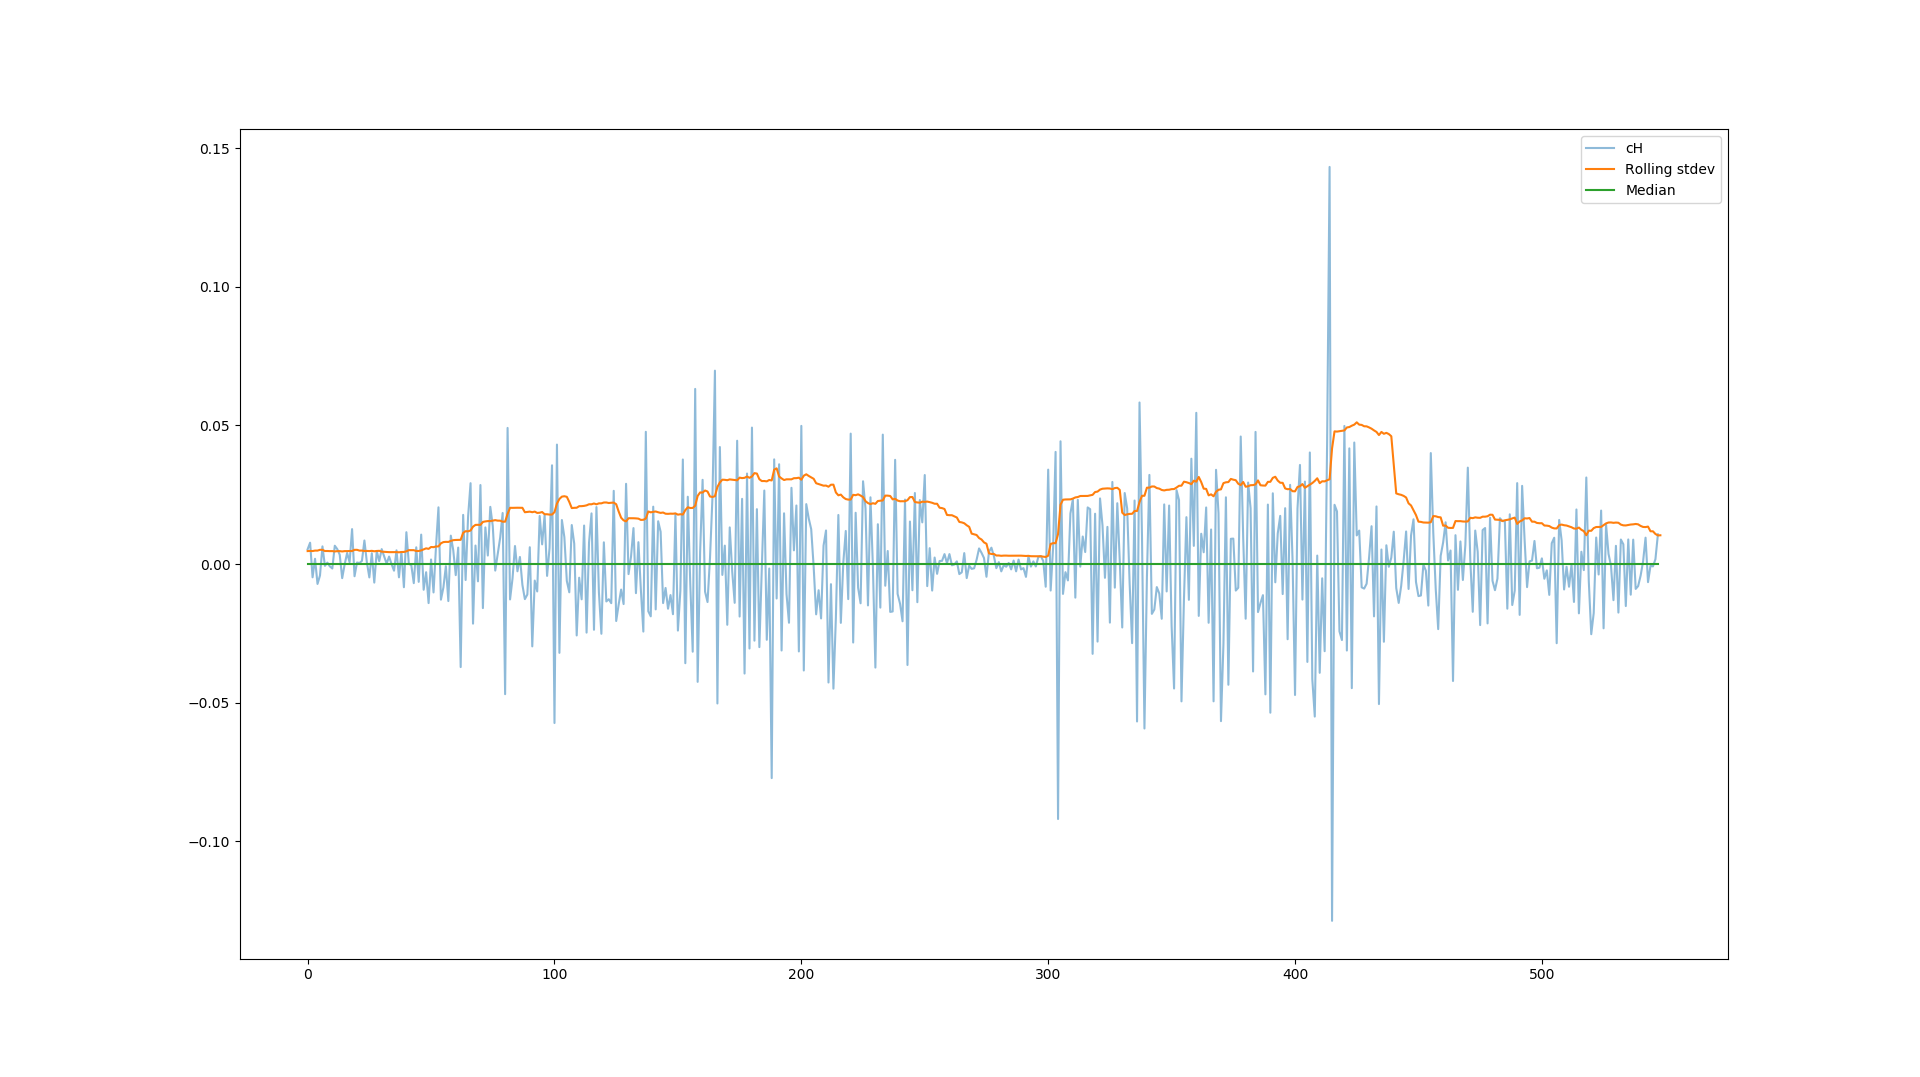
Signal 1 Signal 2

The goal is to identify the sections with smaller variances compared to the rest (For Python, that is to get their index value in the array). In the first signal, there are two such sections (one at the left end and one at the middle). In the second signal, there is one such section at the middle.

What I've tried so far

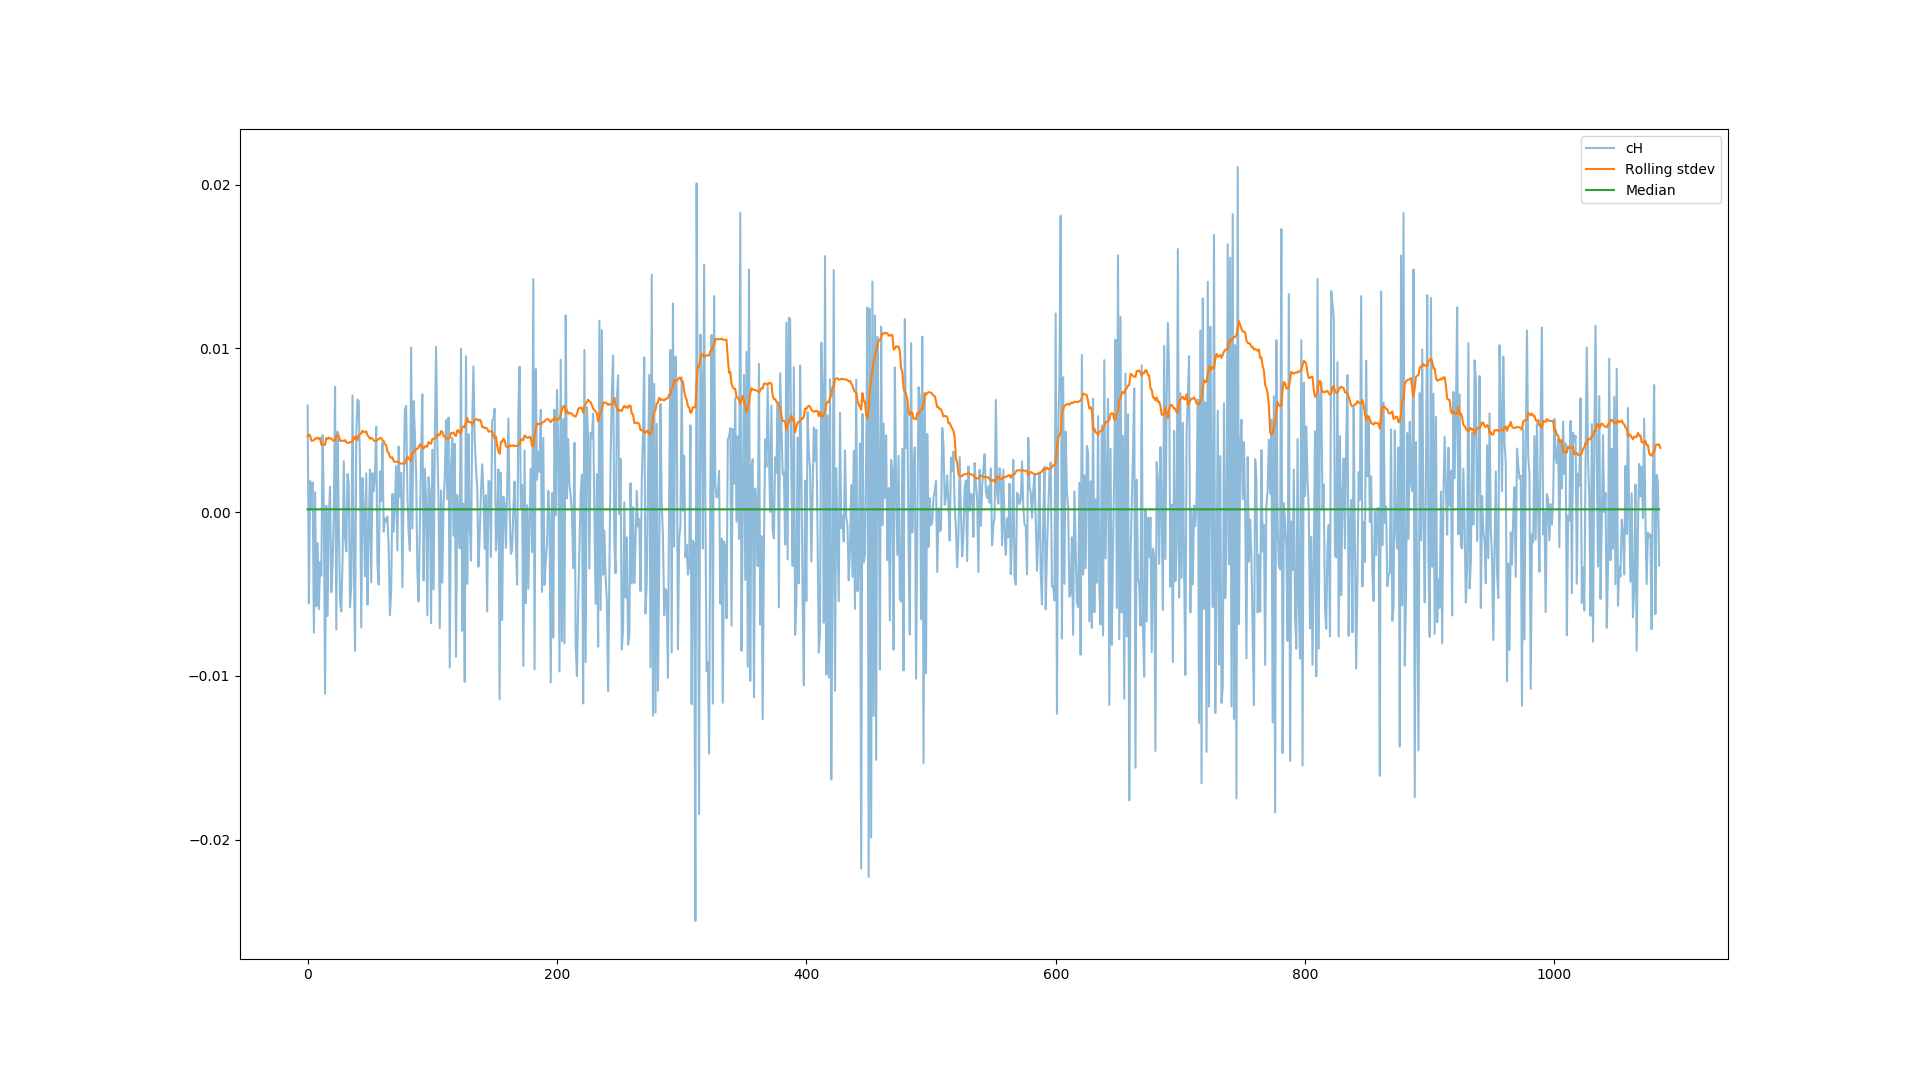
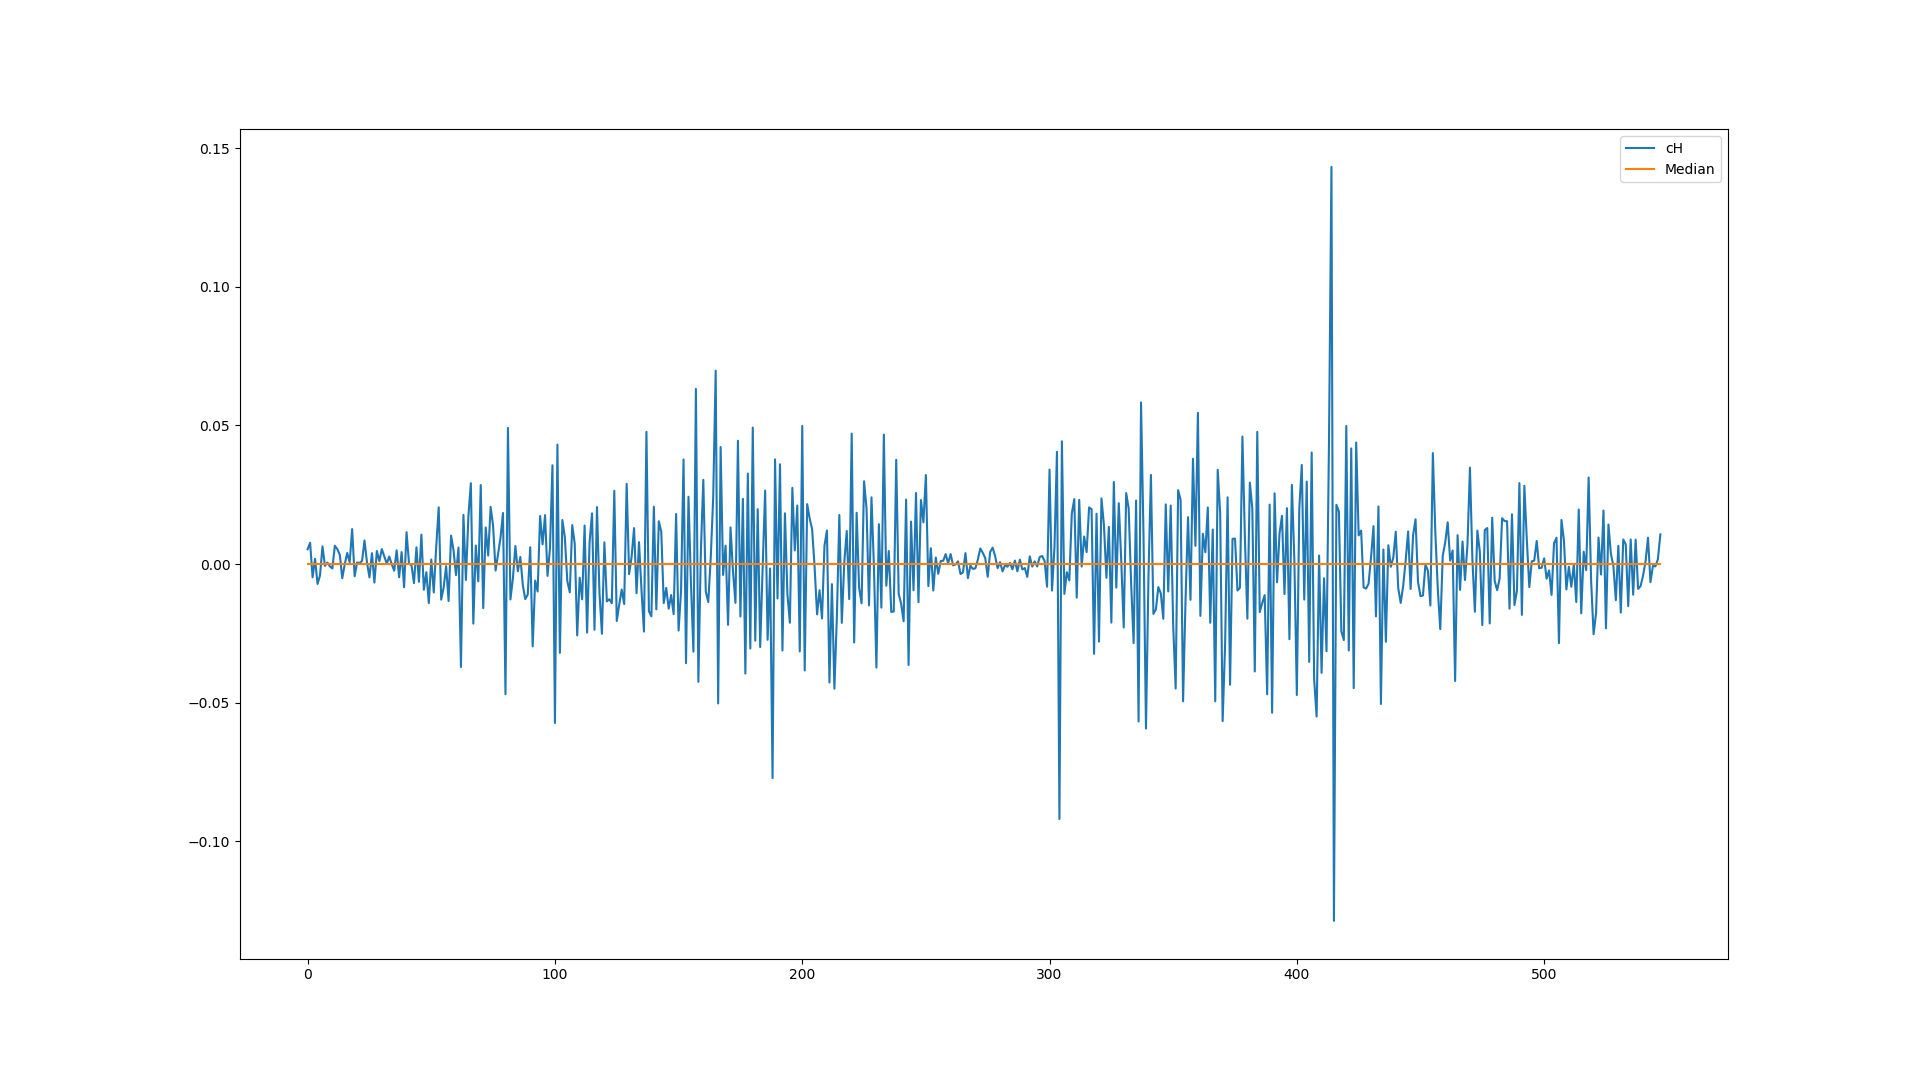
I've tried computing the local stdev in each signals with window size 25 and produced the following plots:

Signal 1 stdev Signal 2 stdev

From here on, I can use threshold to select sections with small stdev. However, one can see that both have different y-axis, and need different threshold values to isolate the low variance sections. Furthermore, applying a rolling window is notoriously computational expensive (I have to apply this on ~5,000,000 similar one-dimensional signals). So the question is, what is a quick method to identify sections that can be applied to both signals?

EDIT

I've put two sample signals at here and here.


$\endgroup$
3
  • 2
    $\begingroup$ Get an approximate envelope by taking the absolute value and applying a low pass filter. Then use something like Forward Consecutive Mean Excision to separate the large envelope from the small envelope. $\endgroup$
    – Andy Walls
    Commented Jun 17, 2018 at 0:31
  • $\begingroup$ It would be good to share the signals data. $\endgroup$
    – Royi
    Commented Jun 17, 2018 at 4:17
  • $\begingroup$ @Chess960. Could you please review my answer? If something missing let me know. Else, could you please mark it? $\endgroup$
    – Royi
    Commented Oct 9, 2022 at 16:24

2 Answers 2

1
$\begingroup$

What you did is the reasonable solution.
From here you can do 2 things to mitigate your issues:

  1. Computation Efficiency
    You can use online calculation of the Mean and the STD.
    Remember when you move one sample to the right 24 samples are shared.
    Hence if you take advantage of that you'll get a performance boost.

  2. Threshold
    Use adaptive threshold per signal if your classification of the STD is relative. Namely per signal you want to find zones with high variance relative to other zones in the same signal (And not an absolute measure).
    You could use statistical properties of the STD of the signal like Mean / Median or even use adaptive Threhshold method like Otsu's Method.

$\endgroup$
1
$\begingroup$

Without comprehensively looking at you data, nothing more than speculation can be offered here.

I’m not particularly available but others are probably more eager for a challenge.

not too old statistics books will caution against using estimates of $\sigma$ because they are very sensitive to outliers. See for example:

Wilcox, Rand R. Fundamentals of modern statistical methods: Substantially improving power and accuracy. Springer Science & Business Media, 2010.

If your 5.E6 signals are files a two pass forward/backward scheme would make things considerably easier. You avoid the lag that windows introduce as well as getting estimates of average intensity. Even if real time, a fixed lag will improve performance. Your results hint at window lag on the back side of your transients.

There is always a performance complexity trade off but order-statistics are more dependable and if you use a priority queue, it isn’t anywhere near doing a sort every new sample.

In Rabiner’s speech processing book, he follows a median filter with a linear filter to detect quiet intervals.

Rabiner, Lawrence R., and Biing-Hwang Juang. Fundamentals of speech recognition. Vol. 14. Englewood Cliffs: PTR Prentice Hall, 1993.

You can also go with a run length scheme or an M out of N test on absolute amplitude.

You haven’t said too much about your data but there will be clues.

Finally, the hardest part is defining your metrics. Processing data without having some understanding of your performance is not usually useful. Is it better when low variance intervals are more accurately determined or the converse, Your examples show more high intensity than quiet periods. Running a STFT on some of your data to see if there are spectral changes is worth the effort.

Another thought is to pursue the transition regions. Finding a set of thresholds (or features ) on jumps places less emphasis on the absolute levels of a particular file.

Wavelets often do well in change detection.

In summary, what you have done so far isn't insane and probably reasonable but you should try some other things as well. Good and fast is not impossible but there is a trade off.

$\endgroup$

Your Answer

By clicking “Post Your Answer”, you agree to our terms of service and acknowledge you have read our privacy policy.

Not the answer you're looking for? Browse other questions tagged or ask your own question.