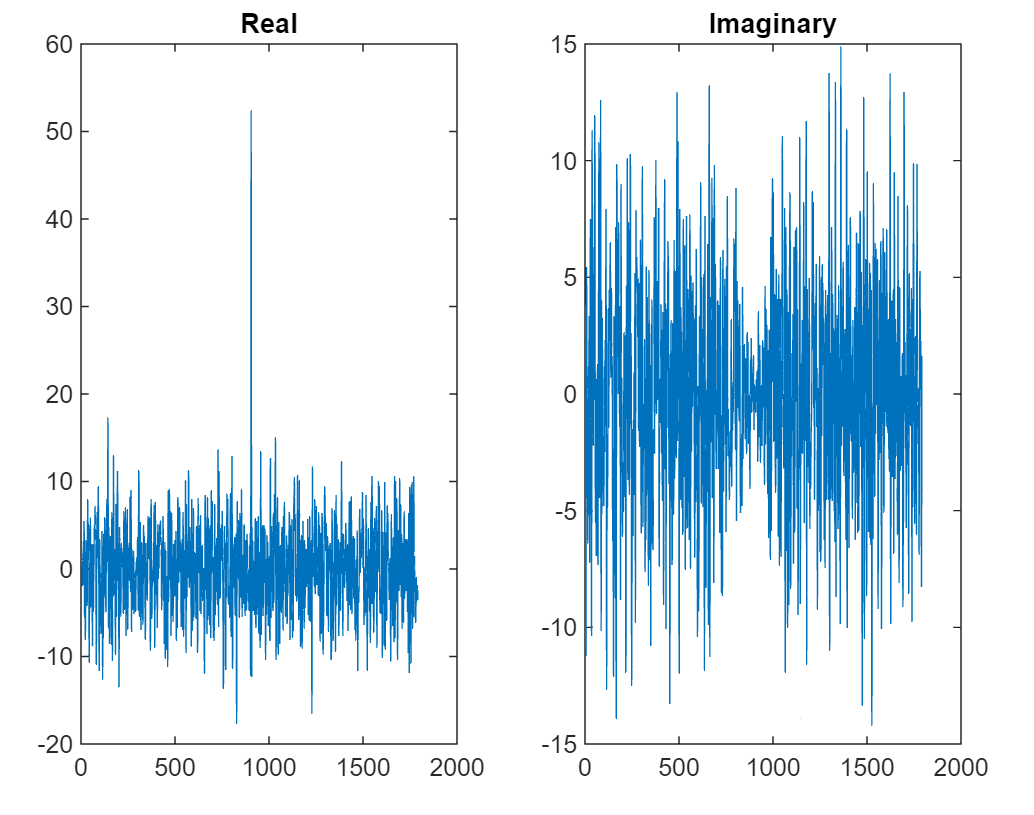
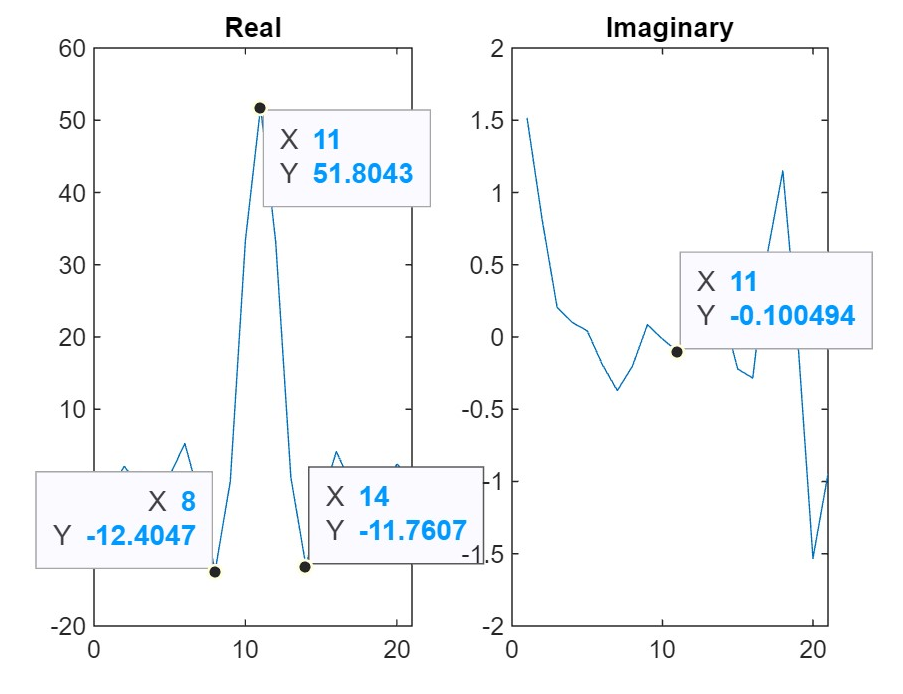
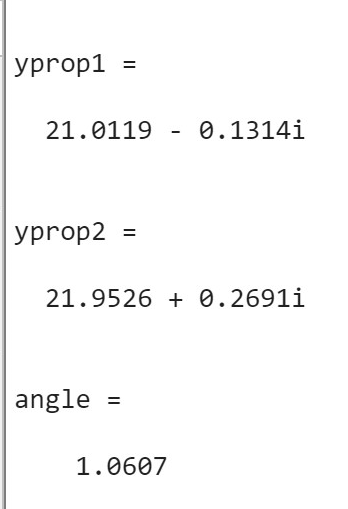
As further described in these posts:
Carrier frequency offset estimation for QPSK and asymmetrical spectrum
Phase synchronization in BPSK
This is an implementation of the "cross-product frequency discriminator". A single phasor on the complex IQ plane in the time domain with a frequency offset will rotate (counter-clockwise for a positive frequency offset and clockwise for a negative frequency offset). If you take two samples at different points in time, there will be a phase difference between the two samples given the frequency offset (since frequency is a change in phase versus a change in time or the time derivative of phase: $d\phi/dt$). When we take the complex conjugate product between two such phasors, the result will be a complex phasor with an angle equal to the difference between the two phasors (since the angles add, with a complex conjugate they will subtract). Thus we can measure the angle versus time and therefore the frequency. Further, if the angle is small, due to the small angle approximation, the normalized imaginary term of the complex conjugate product will be the angle, and therefore proportional to the angle when not normalized, and therefore if used on two samples seperated in time will be proportional to the frequency.
In the OP's formula, the denominator is proportional to the time difference between the two phasors, and the $\pi/2$ is normalizing the frequency result. In any case the result if implemented properly will be proportional to an actual frequency offset.
A similar and perhaps simpler CFO determination can be resolved from the autocorrelation of the ZC sequence in the received signal: If $y(n)$ is an oversampled auto-correlation of the ZC sequence portion of the received sequence, (oversampled meaning multiple samples for every value in the ZC sequence), then the peak of $y(n)$ will always occur at offset 0 (as expected for an autocorrelation) and the adjacent samples would have a phase proportional to frequency offset. This forms a frequency discriminator as described in this link.
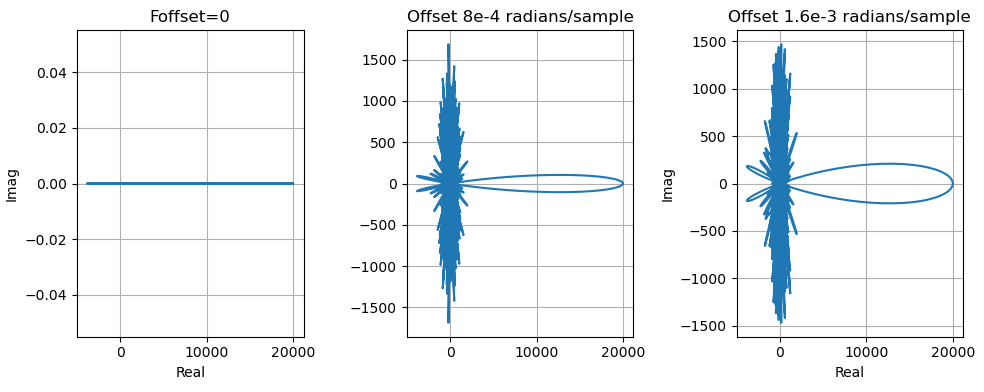
I demonstrate that for GPS Gold Code sequences (having similar correlation properties to the ZC sequence that I don't readily have). Below shows the autocorrelation plotted on a complex real-imaginary plane for the case of no frequency offset and increasing frequency offsets:
For the third case above, if we plot the absolute value versus time, and then zoom in on the peak, with the red circles denoting the actual samples (for this waveform I was oversampled by a factor of 20, since the correlation of the original sequence if not oversampled goes to a null within a one sample delay). The point here is to give more insight into what the above complex plots represent where we can simultaneously see the magnitude and phase versus sample offset, in comparison to a plot of the absolute value of the autocorrelation.
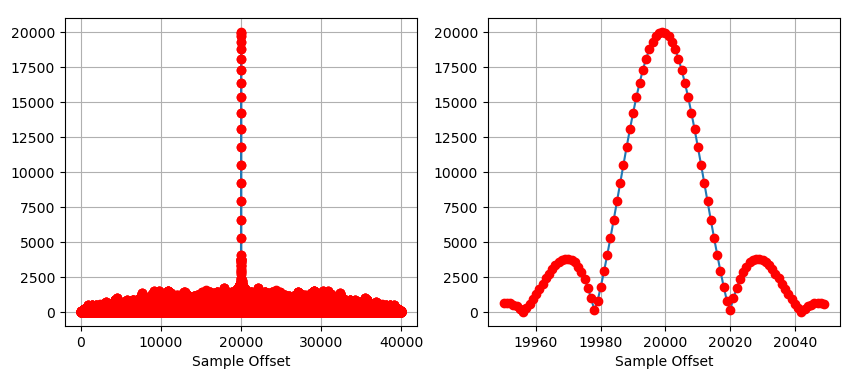
This doesn't appear to be the specific algorithm the OP is using, but hoping that it can provide insight into how such frequency discriminators that operate on correlated results work in general. In this case it shows how the autocorrelation of the oversampled sequence can be used as a very effective frequency discriminator, with the best samples chosen to be half way down the correlation peak (notice here with the complex plots above that it is the imaginary component of the autocorrelation at the samples corresponding to half way on the correlation peak, that have the biggest sensitivity to a frequency offset). For small angles the imaginary component is directly proportional to the angle since for small $\theta$, $\sin(\theta) \approx \theta$.
Note regarding recent update from OP:
The phase error between samples due to a frequency offset is independent of the carrier frequency as $\Delta f = f_c - (f_c +\Delta f)$. The phase error is dependent only on the frequency offset and time between samples given by:
$$\Delta \phi = 2\pi \Delta f \Delta t$$


