1
$\begingroup$

Given the signal $x_a(t)=4cos(2\pi\times40t+\pi/3)+10cos(2\pi\times160t-\pi/6)$, I am to sample it at $f_s=200Hz$ and find the expression for $x[n]$

My process: $$x[n]=x_a(nT)=x_a({n\over f_s})=4cos(0.4n\pi+\pi/3)+10cos(1.6n\pi-\pi/6)$$ and due to aliasing: $$x[n]=4cos(0.4n\pi+\pi/3)+10cos(0.4n\pi+\pi/6)$$

How do I verify that the expression for the discrete-time signal is correct?

What I've tried so far:

A1 = 4; A2 = 10; f1 = 40; f2 = 160; th1 = pi/3; th2 = -pi/6; fs = 200;
dt = 0.0001;

t = 0:dt:0.2;

x_a = A1*cos(2*pi*f1.*t + th1) + A2*cos(2*pi*f2.*t + th2);

plot(t, x_a);
hold on;

n = 0:0.2*fs;
x_n = A1*cos(0.4*pi.*n + pi/3) + A2*cos(0.4*pi.*n + pi/6);

stem(n/fs,x_n,':', 'LineWidth', 1.5);
hold off;

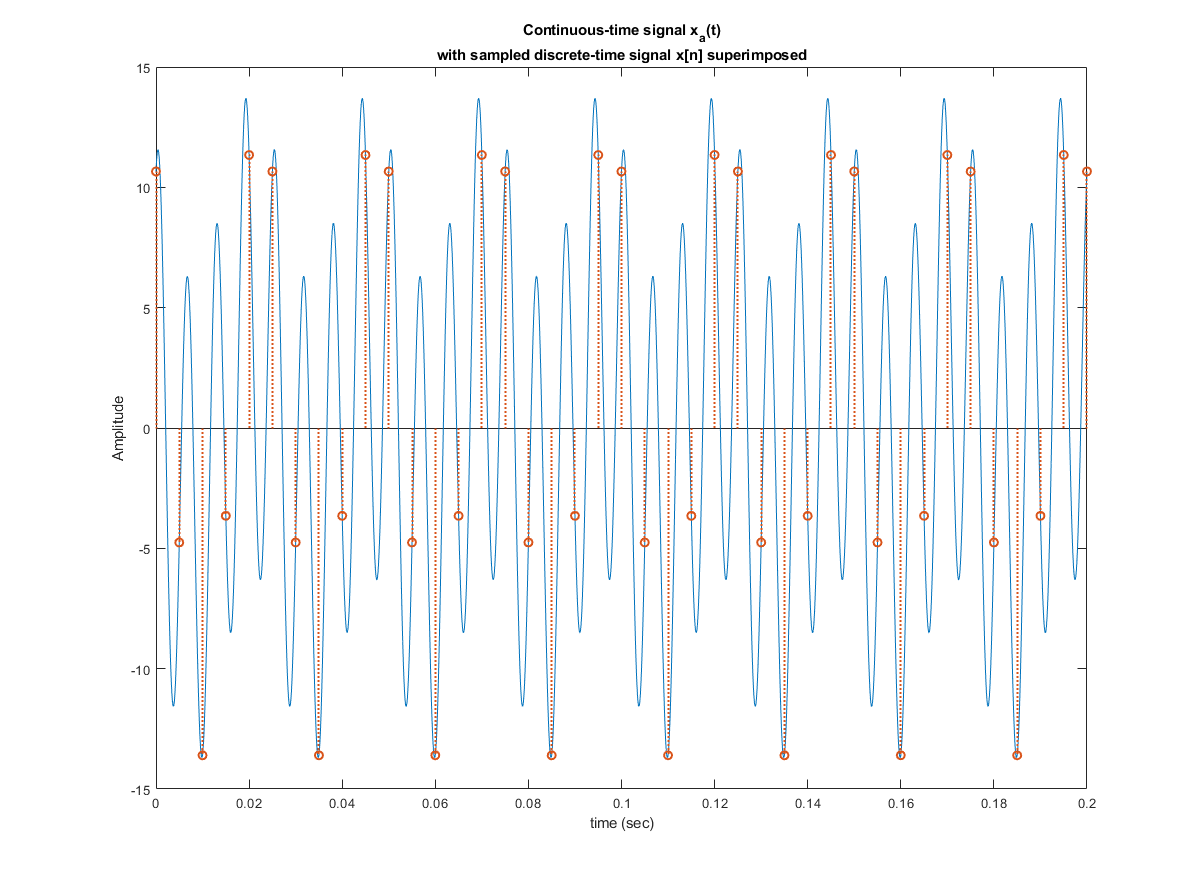
And I get the following plot:
Plot of the continuous-time signal and the discrete signal

So it seems like the discrete signal's values match those of the continuous signal.

Is plotting both signals and checking if the sampled values match the right way of verifying?

I'm still wrapping my head around sampling so any additional information that can help me understand the process and the outcome better is more than welcome.

Also, it seems like there's no way to properly reconstruct the signal with the given sampling frequency so I'm assuming the point of this exercise is just to test my knowledge of sampling and this is not a practical way of sampling, correct?

Thank you!

$\endgroup$

1 Answer 1

0
$\begingroup$

The best way is to let the program to sample the function for you.

You can define a function. And you don't even need a separate program, you can use an anonymous function, @(t) expr for MATLAB/Octave (That seems to be the program you are using).

  x_a = @(t) A1*cos(2*pi*f1.*t + th1) + A2*cos(2*pi*f2.*t + th2);

Then you could plot with

  plot(t, x_a(t), '-', n/fs, x_a(n/fs), 'o');

since you are ploting x, x_a(x) there is nothing that could go wrong in the sampling, the time values you pass will be replaced automatically in your expression.

If you want the expression you can use symbolic computation, however when I need to do so I use wxmaxima or sympy

$\endgroup$
4
  • $\begingroup$ So in MATLAB I can just use "@(t)" and it will decide the sampling for it automatically? If so, that's super handy. Also, thank you for the other software suggestions $\endgroup$
    – Kevin KZ
    Commented Mar 12, 2021 at 5:21
  • $\begingroup$ Actually you decide the sampling in the subsequent calls to the generated function. See the plot line try it yourself. And when you are happy follow these steps. Thank you. $\endgroup$
    – Bob
    Commented Mar 12, 2021 at 6:11
  • $\begingroup$ that's good information; thanks. But my question was more about "how to prove that my derived expression for sampling is correct, and how to do so via graphing it" $\endgroup$
    – Kevin KZ
    Commented Mar 14, 2021 at 17:26
  • $\begingroup$ I think your way to visualize is correct, that's all, visualization is not a way to prove, is just a quick way to check if nothing is terribly wrong. Proof would really need some symbolic manipulation. What I am telling is that if you define a function and use it to sample, the sampling will be correct by construction, the proof is immediate by substituting the variables. $\endgroup$
    – Bob
    Commented Mar 14, 2021 at 19:31

Your Answer

By clicking “Post Your Answer”, you agree to our terms of service and acknowledge you have read our privacy policy.

Not the answer you're looking for? Browse other questions tagged or ask your own question.