I am attempting to understand how to manipulate portions of a cascaded series of biquad notch filters in a control system I am working with.
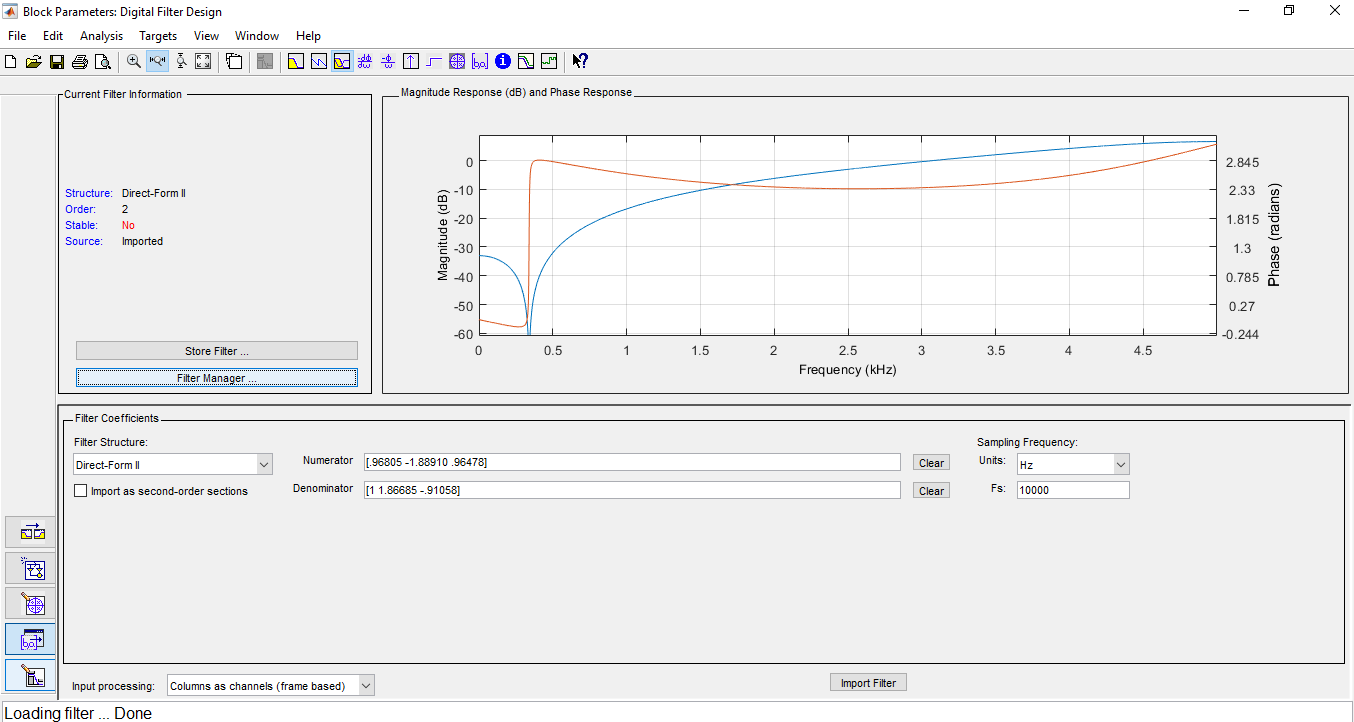
As part of determining the composite response of all the cascaded filters, I am starting with looking at the individual biquad filters. I have taken the existing control system coefficients that I have for the filters and have saved the various biquad filters in the Filter design tool. When I use the MATLAB/Simulink filter design tool, I obtain an unexpected response as well as an unstable root/pole plot. I have excerpted an image below of one of the filters from the control system.
 The system sampling frequency is 10 khz. The Form is Direct Form II. The a0 coefficient is normalized to 1.
My specific questions are:
Is this response still consistent with a notch filter?
If this is still applicable as a notch filter, why would the filter start with a negative magnitude and then return to a positive magnitude? For context, I am used to the analog realm and a notch filter starting at 0 db and ending at 0db.
If I needed to attenuate a specific frequency as viewed from power spectra of the feedback in the control system, would it be appropriate to modify a particular notch filter of my cascaded series to focus in on that frequency or since they are cascaded, would I have to modify all terms slightly?
Thanks for any insight.
