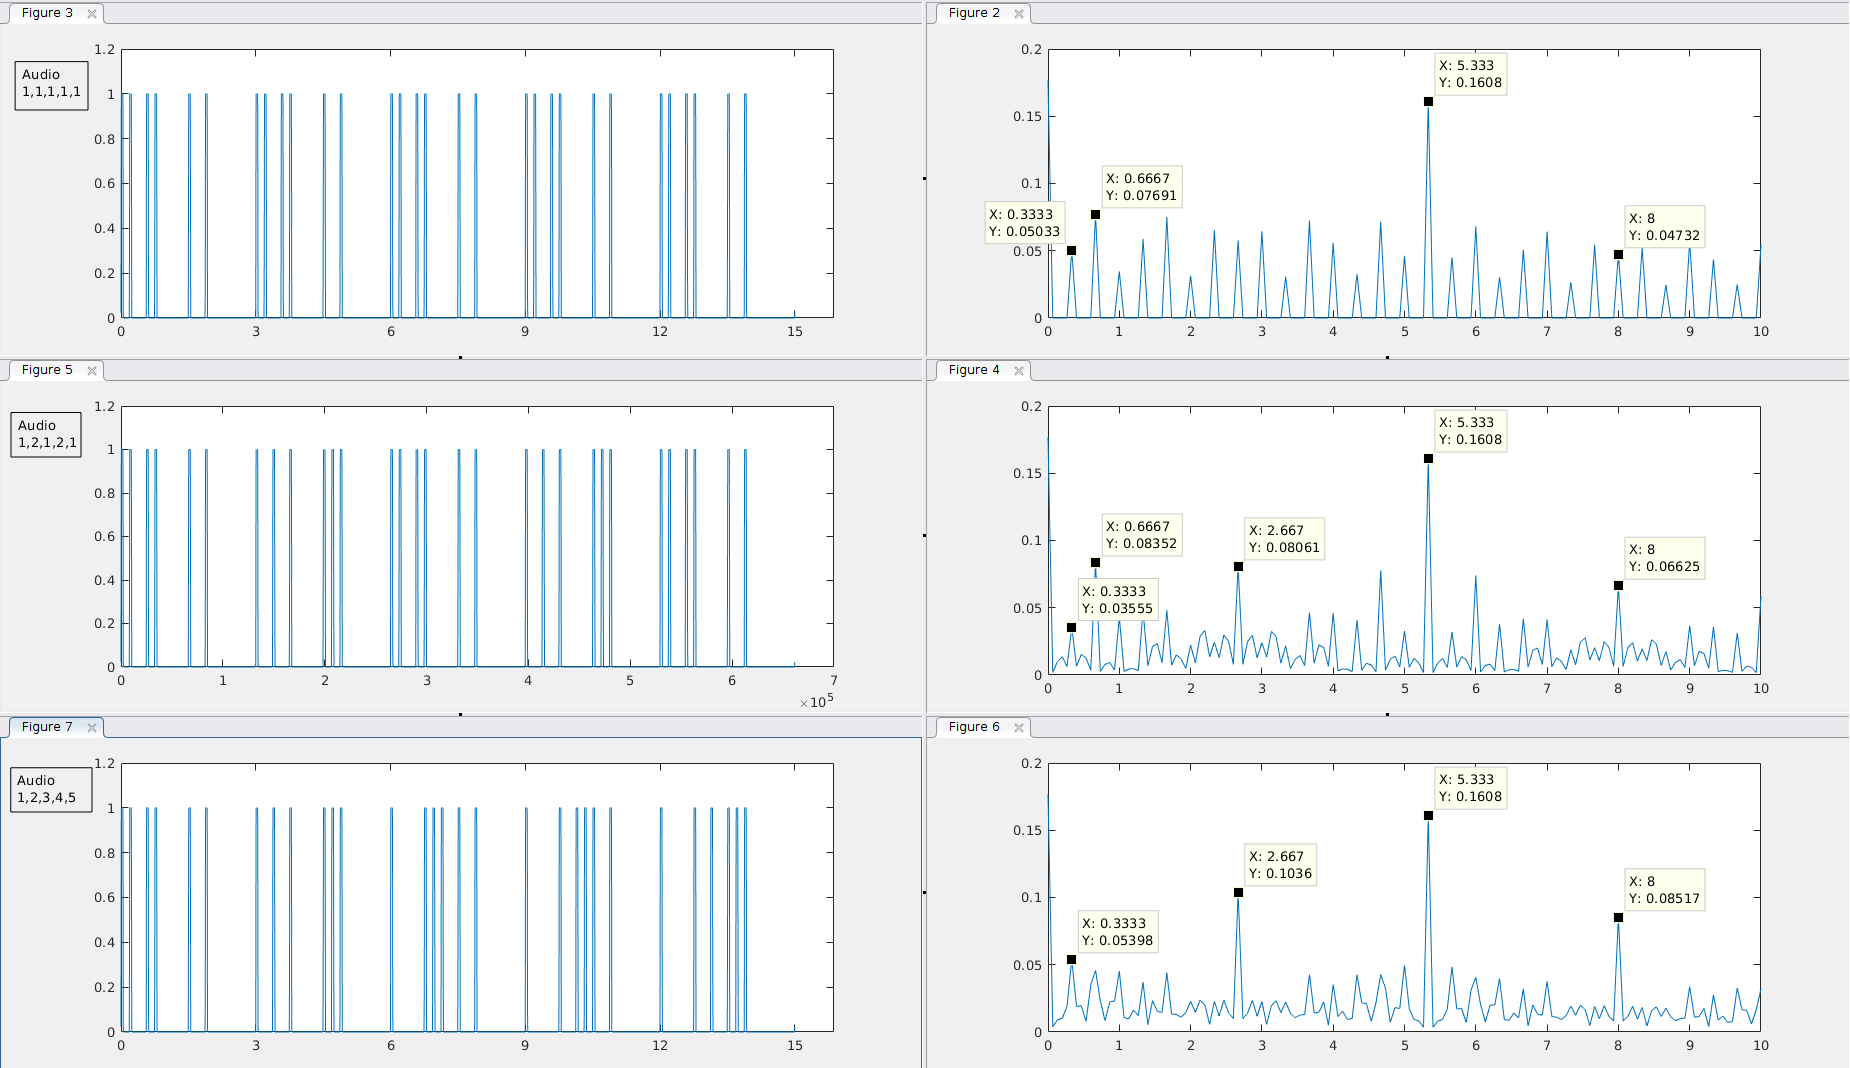
I ran FFT on three audio files and found that the results for some have more peaks than the other. Could anyone give me any conceptual explanation as to what determines these peaks? Below are plots of the audio sound envelope (left) and the corresponding FFT results (right). If I look at the plots on the right, e.g., the FFT for audio 1 has no peaks between 0.33 and 0.67 but the FFT for audio 2 and 3 do. I am not quite sure whether these additional peaks are meaningful or just artifacts of my particular sound file and FFT setup. More explanations about the audio files below.
Each peak in the audio plots represents a sinewave tone. The smallest inter-tone interval is 187.5 ms. Other inter-tone intervals could be 2x, 4x, or 6x187.5 ms. Each audio file lasts 5x3 seconds. The first row is the result from the exact same 3-second rhythm looped 5 times. The last two are the repetition of different 3-s rhythms. The inter-tone intervals in the three files are as follows:
Here's my FFT script:
n = length(sound);
nyquist = srate/2;
f = linspace(0, nyquist, floor(n/2)+1);
fourier_coef = fft(snd);
fourier_coef = fourier_coef/n;
amp = abs(fourier_coef);
amp = amp .*2;
Thank you.
Teresa


