I'm using cosine window function of order $p$:
$$ f(t) = \frac{2^p (p!)^2}{(2 p!)} \left(1 + \cos(\pi t)\right)^p $$
for frequency identification in real signals with several frequency components.
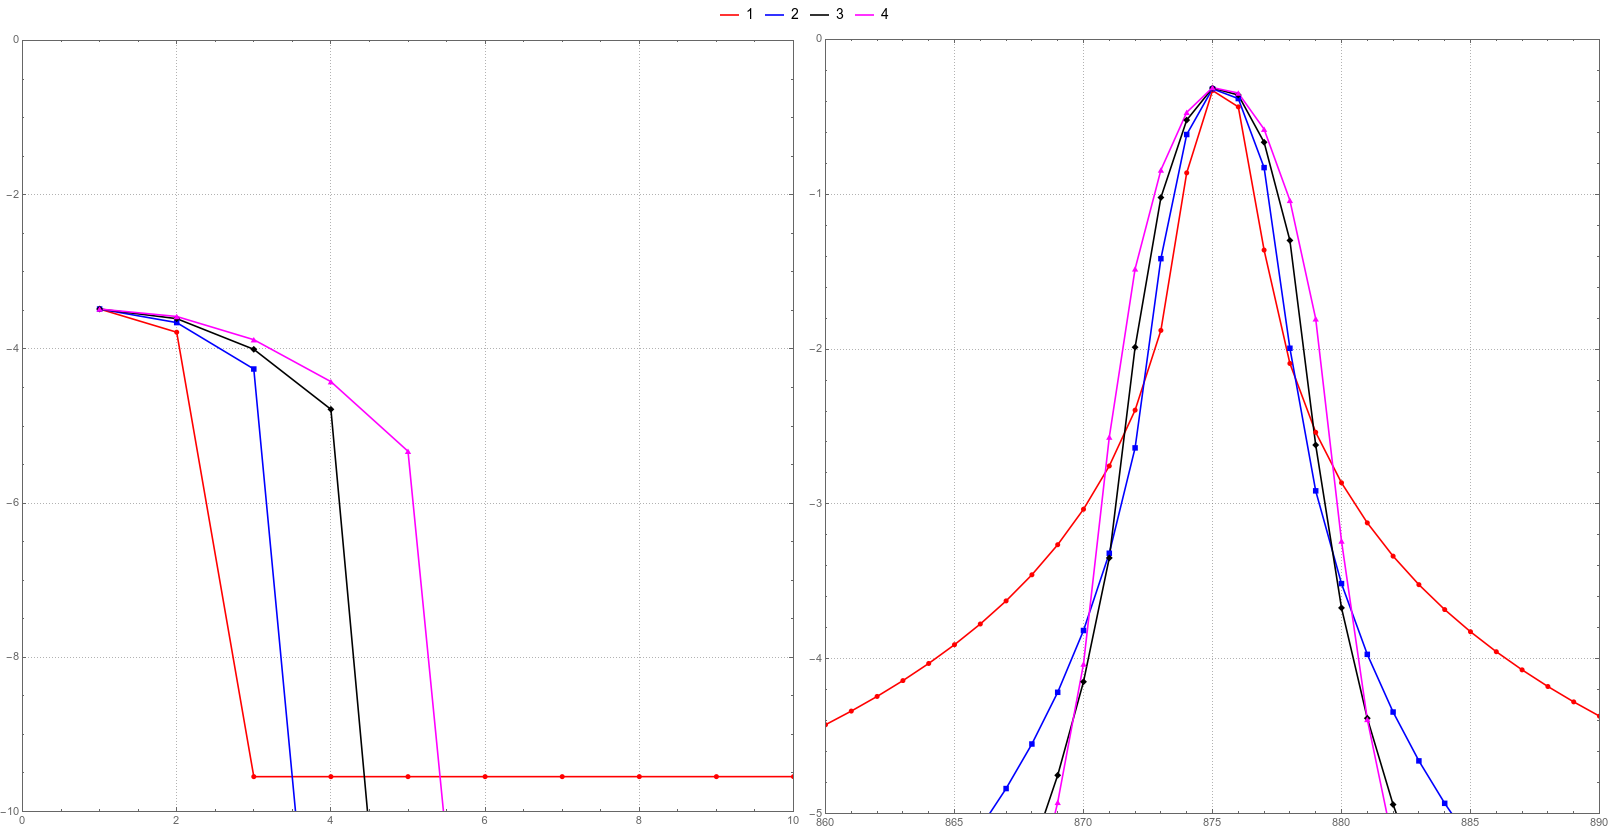
For a simple test signal $ s(t) = 0.1 + \sin(2 \pi t \times 0.2134567)$ with $t = 1,2,\dots,4096 $ an 'artifact' is observed at low frequencies in Fourier amplitude spectra.
First, the signal mean is removed (computed numerically), then Fourier is performed and log10 of its' absolute value is plotted for different window orders.
For signals with zero mean no 'artifact' is observed. Do I understand correctly that this is due to the amplification of low-frequency components by window function? How this effect is called? And how it can be reduced?
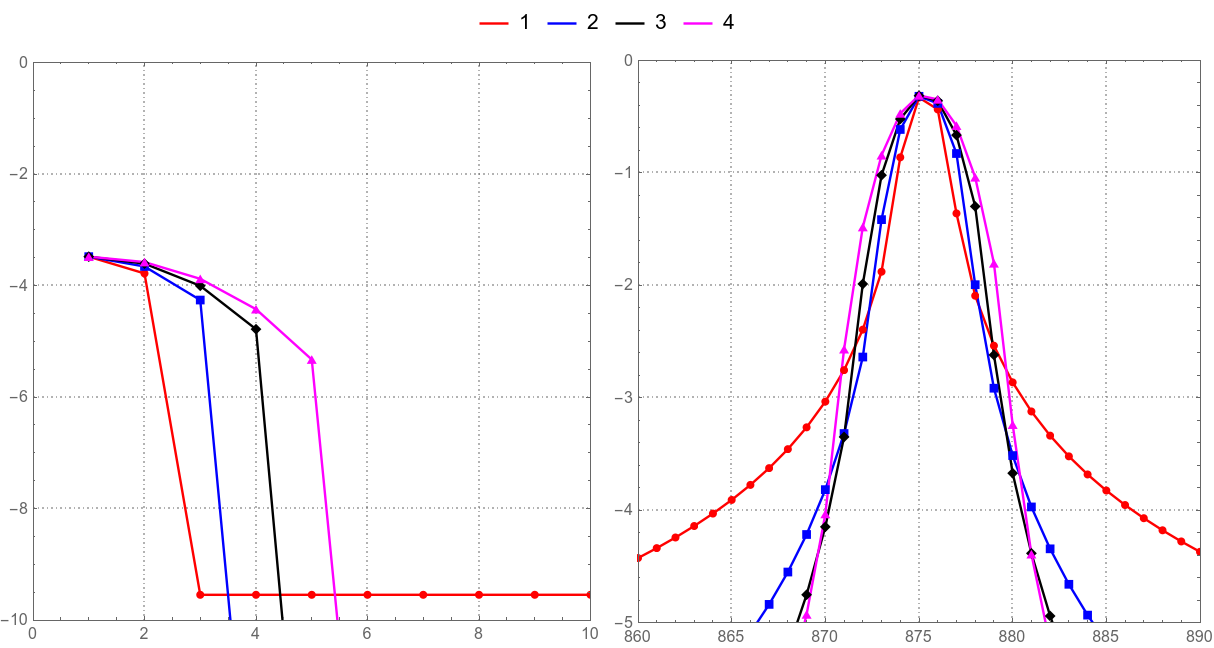
On the figure: log10 of Fourier amplitude spectra low-frequency components (left) and main peak (right) for different window orders.
Edit
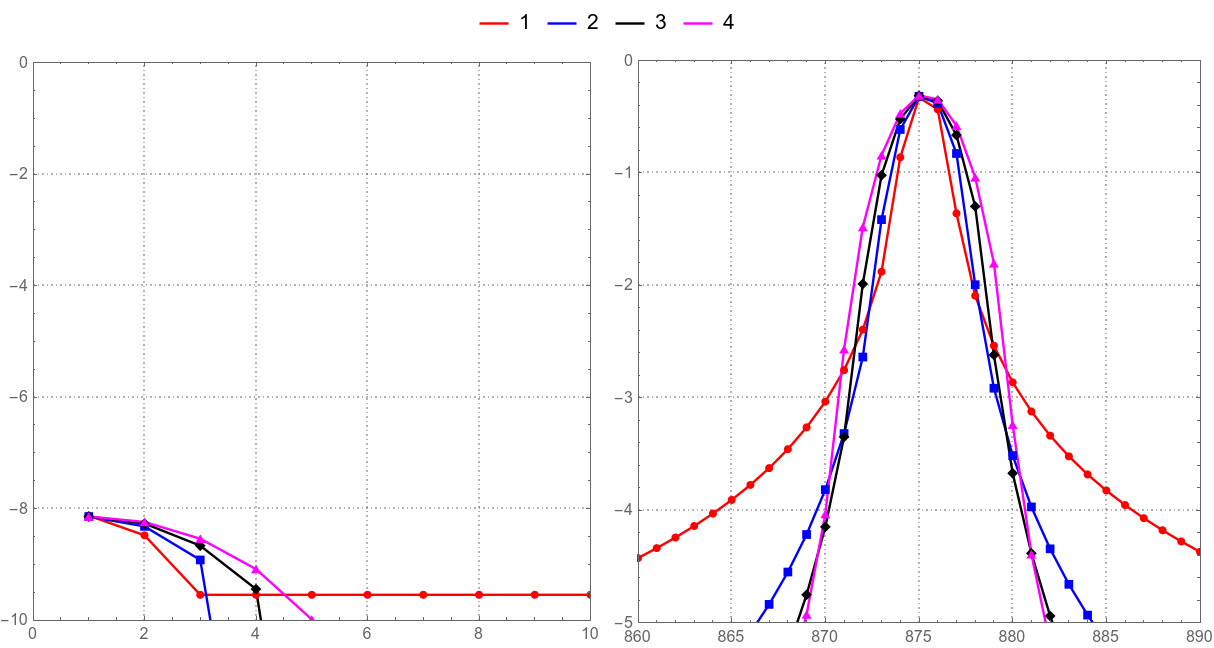
Added Mathematica code used to generate figure in the original post together with 'true' mean subtraction with reduces this effect (4 orders in this example).
My main concern was that given a signal with low-frequency main peak, it can be shifted by this window effect.
(* def window function *)
ClearAll[window] ;
window[order_,length_] := 2^order Factorial[order]^2/Factorial[2 order] (1 + Cos[2 Pi ((N[Range[length]]-1)/length - 1/2)])^order ;
(* plot window function *)
ListPlot[
    Map[Curry[window][4096],Range[4]],
    AspectRatio -> 1,
    PlotTheme -> "Detailed",
    PlotStyle -> List[Red, Blue, Black, Magenta],
    ImageSize -> 400
]

(* def test signal *)
sig = 0.1 + Sin[2 Pi Range[4096] 0.2134567] ;

(* input data (signal with removed mean value) *)
dat = sig - Mean[sig] ;

(* compute spectra *)
fou1 = Fourier[ dat window[1,4096],FourierParameters->{-1,1}] ; fou1 = Log10[Abs[fou1]] ; fou1 = Take[fou1,2048] ;
fou2 = Fourier[ dat window[2,4096],FourierParameters->{-1,1}] ; fou2 = Log10[Abs[fou2]] ; fou2 = Take[fou2,2048] ;
fou3 = Fourier[ dat window[3,4096],FourierParameters->{-1,1}] ; fou3 = Log10[Abs[fou3]] ; fou3 = Take[fou3,2048] ;
fou4 = Fourier[ dat window[4,4096],FourierParameters->{-1,1}] ; fou4 = Log10[Abs[fou4]] ; fou4 = Take[fou4,2048] ;

(* plot spectra parts *)
Legended[
    Grid[
        List[
            List[
                ListPlot[List[fou1,fou2,fou3,fou4], PlotRange -> List[List[0,10],List[0,-10]], PlotTheme -> "Detailed", Joined -> True, PlotMarkers -> Automatic, AspectRatio -> 1, PlotStyle -> List[Red, Blue, Black, Magenta], ImageSize -> 400],
                ListPlot[List[fou1,fou2,fou3,fou4],PlotRange -> List[List[860,890],List[0,-5]], PlotTheme -> "Detailed", Joined -> True, PlotMarkers -> Automatic, AspectRatio -> 1, PlotStyle -> List[Red, Blue, Black, Magenta], ImageSize -> 400]
            ]
        ]
    ],
    Placed[LineLegend[{Red,Blue,Black,Magenta},{1,2,3,4},LegendLayout->"Row"],Top]
]

(* 'true' mean *)
ClearAll[fun] ;
fun[cor_?NumericQ] := Block[
    {},
    mea = Mean[sig] ;
    dat = sig - mea + cor ;
    dat = dat window[1,4096] ;
    fst = First[Abs[Fourier[dat,FourierParameters->{-1,1}]]]
] ;
add = cor /. Last[FindMinimum[fun[cor],{cor,0.0}]]

(* substruct true mean *)
dat = sig - (Mean[sig] - add) ;

(* compute spectra *)
fou1 = Fourier[ dat window[1,4096],FourierParameters->{-1,1}] ; fou1 = Log10[Abs[fou1]] ; fou1 = Take[fou1,2048] ;
fou2 = Fourier[ dat window[2,4096],FourierParameters->{-1,1}] ; fou2 = Log10[Abs[fou2]] ; fou2 = Take[fou2,2048] ;
fou3 = Fourier[ dat window[3,4096],FourierParameters->{-1,1}] ; fou3 = Log10[Abs[fou3]] ; fou3 = Take[fou3,2048] ;
fou4 = Fourier[ dat window[4,4096],FourierParameters->{-1,1}] ; fou4 = Log10[Abs[fou4]] ; fou4 = Take[fou4,2048] ;

(* plot spectra parts *)
Legended[
    Grid[
        List[
            List[
                ListPlot[List[fou1,fou2,fou3,fou4], PlotRange -> List[List[0,10],List[0,-10]], PlotTheme -> "Detailed", Joined -> True, PlotMarkers -> Automatic, AspectRatio -> 1, PlotStyle -> List[Red, Blue, Black, Magenta], ImageSize -> 400],
                ListPlot[List[fou1,fou2,fou3,fou4],PlotRange -> List[List[860,890],List[0,-5]], PlotTheme -> "Detailed", Joined -> True, PlotMarkers -> Automatic, AspectRatio -> 1, PlotStyle -> List[Red, Blue, Black, Magenta], ImageSize -> 400]
            ]
        ]
    ],
    Placed[LineLegend[{Red,Blue,Black,Magenta},{1,2,3,4},LegendLayout->"Row"],Top]
]


