1
$\begingroup$

I am trying to derive the pdf of the sum of independent random variables. At first i would like to do this for a simple case: sum of gaussian random variables. I was surprised to see that i don't get a gaussian density function when i sum an even number of gaussian random variables. I actually get: enter image description here
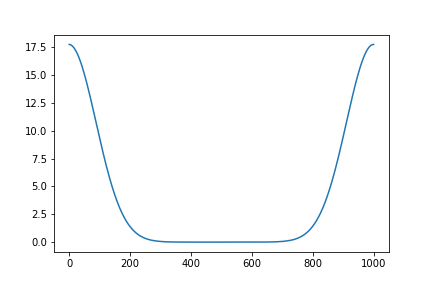
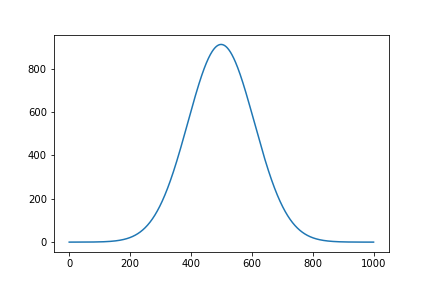
which looks like two halfs of a gaussian distribution. On the other hand, when i sum an odd number of gaussian distributions i get the right distribution:

enter image description here

below the code i used to produce the results above:

import numpy as np
from scipy.stats import norm
from scipy.fftpack import fft,ifft
import matplotlib.pyplot as plt
%matplotlib inline

a=10**(-15)
end=norm(0,1).ppf(a)
sample=np.linspace(end,-end,1000)
pdf=norm(0,1).pdf(sample)
plt.subplot(211)
plt.plot(np.real(ifft(fft(pdf)**2)))
plt.subplot(212)
plt.plot(np.real(ifft(fft(pdf)**3)))

Could someone help me understand why i get odd results for even sums of gaussians distribution? Thanks in advance

$\endgroup$
1
  • $\begingroup$ what i am saying is that the pdf of X+Y with X and Y independent variables is the convolution of the pdfs of X and Y. I using fft because it transforms the convolution operation into a product. $\endgroup$ Commented May 8, 2018 at 22:34

2 Answers 2

2
$\begingroup$

The FFT algorithm expects the origin of the signal to be on the leftmost sample of the signal. You are convolving two shifted Gaussian together, yielding a Gaussian that is even more shifted. Because of the FFT imposes periodicity, when the curve is shifted past the right edge it comes back in on the left edge.

Whit an odd number the shift is exactly the full width of the signal, so you don’t notice it.

A solution would be to use a zero-mean Gaussian distribution, which you can obtain from yours by ifftshift. After performing the convolution, you can shift it back to where it was using fftshift.

np.fft.fftshift(ifft(fft(np.fft.ifftshift(pdf))**2))
$\endgroup$
1
$\begingroup$

Perhaps you can use a kde function to estimate the kernel?

import numpy as np
import matplotlib.pyplot as plt
from scipy import stats

N = 10**4
x12 =  np.array([ [np.random.normal(),np.random.normal()] for i in range(N)])
X = np.sort(x12[:,0] + x12[:,1])
density = stats.kde.gaussian_kde(X)
plt.plot(X,density(X))

It might be slow, nevertheless, to run for large $N$.

$\endgroup$

Not the answer you're looking for? Browse other questions tagged or ask your own question.