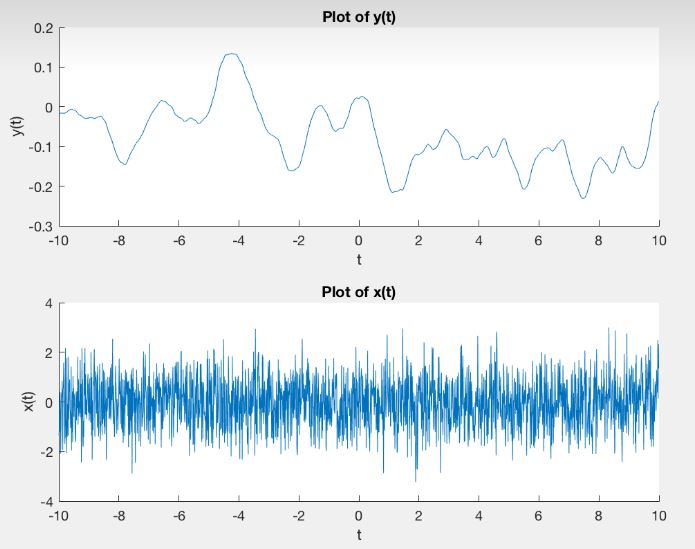
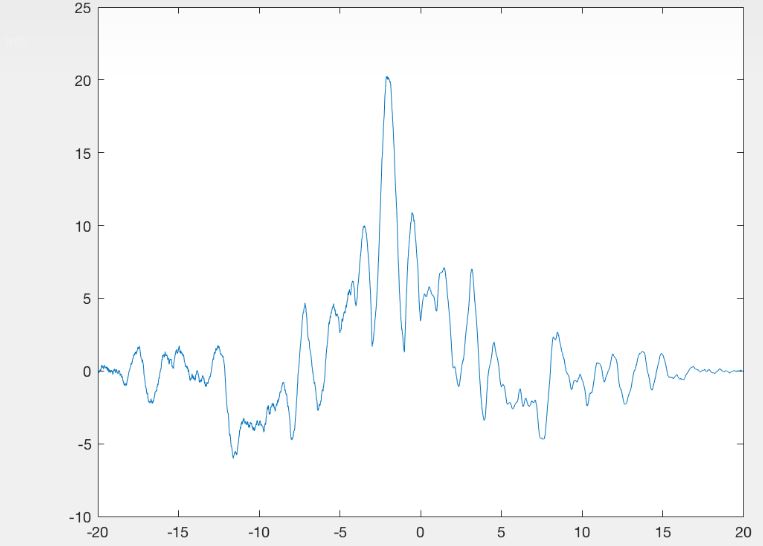
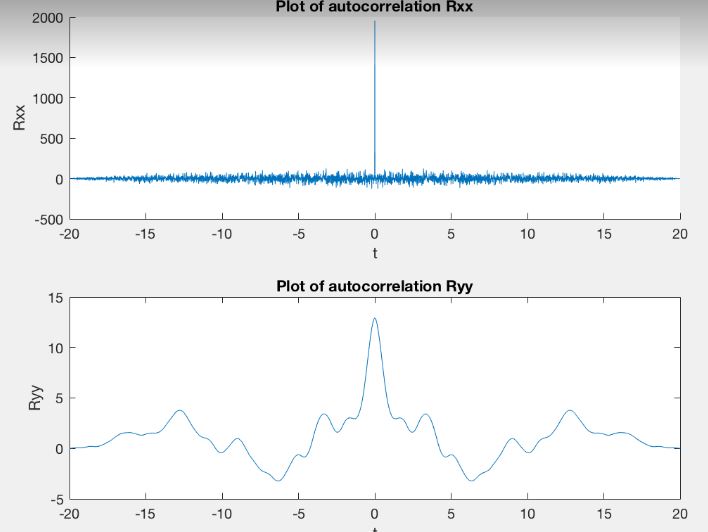
I have an input signal $x(t)$ that is a white Gaussian random signal with mean 0 and variance 1. The signal $y(t)$ is the output of a linear filter with impulse response $$h(t) = |\operatorname{sinc}(t − 2)|.$$ I have plotted the cross-correlation and auto-correlation of the two signals, but have a hard time interpreting what the plots mean. For the cross-correlation, what do all the different spikes mean? What does the peak near 0 mean? For the auto-correlation of $x$ as well, why is there noise but a peak at 0? What about the auto-correlation of $y$?
3 Answers
Autocorrelation of $x$: at zero shift, the two signals being correlated ($x(t)$ and $x(t)$) are identical, hence a large correlation. At any other shift ($x(t)$ and $x(t+\tau)$), the correlation is near zero (no correlation). Some noise there is expected.
Autocorrelation of $y$: at zero shift, as always, there is maximum correlation of the two signals. Because the signal is smooth, correlation changes slowly with increasing shift. At various shifts peaks line up an the correlation has a local maximum.
Crosscorrelation of $x$ and $y$: you’re not showing the magnitude of the y-axis, I presume it’s small because the signals are not correlated. At some shift (it just happens to be close to zero, this is coincidence) there is the absolute maximum because it has to exist somewhere. Again, because $y$ is smooth, the correlation changes smoothly with the shift. But in general you’re looking at smoothed noise here.
If you computed the crosscorrelation by padding the input with zeros (rather than using the circular periodicity imposed by the Fourier transform) then you would expect the peak to be close to 0, as the correlation for larger shifts will include more of the zero values in the padding (the signals overlap less, hence the sum of their point-wise multiplication is closer to 0).
While I agree with almost everything @CrisLuengo wrote in his answer, there is one important thing to correct:
It is no coincidence that you see a signal appear in the cross correllation between $x$ and $y$. If you look closely you'll see that this signal is exactly the horizontal mirroring (around the origin) of your system's transfer function a.k.a. impulse response.
i.e. what you're seeing is: $$x(t) \star y(t) \approx c \cdot h(-t) = c \cdot |\rm{sinc}(-t-2)|$$, where $c$ is some constant that depends on the number of elements in your array representation of the signals (because correlation sums over the multiplied array elements).
Generally, cross-correlating a random input signal with the output signal will give you (a somewhat noisy version of) the time-reversed impulse response of the system. That is what you are seeing here.
The fact that your cross-correlation spikes at about -2 means that you maybe can see a little of $y(t)$ in $x(t)$ if you scoot one or the other by -2, you might see a faint trend in $x(t)$ (clearly the higher frequency signal) that looks a little like $y(t)$. When these trends line up, the cross-correlation will be maximum, even if very small, nonetheless.
We can tell the units to judge how small the cross-correlation really is even if we don't know how wide the summation is (but that would be nice to know). Perchance the scale of the two autocorrelations will tell. The peaks, indicating relative energy, are 2000 and 13. The geometric mean is about 160. So, assuming the windows are the same between cross- and auto-correlations, then 20 out of 160 isn't nothing. It would seem to me that someone slipped a little of $y(t)$ into $x(t)$ and offset one of the two by about -2 units. But it could have been random chance.


