This question is somewhat related to the one asked here: How is multiplexing achieved in spread-spectrum modulations like CSS?
I am looking at the bit error rate (BER) performance of communication systems based on chirp spread spectrum (CSS) like the one implemented by Semtech's LoRa CSS.
Authors of the research paper Range and coexistence analysis of long range unlicensed communication give an analytical expression for computing the $BER$ given the spreading factor ($sf$) and the energy per bit to noise ratio ($E_b/E_0$). The expression is as follows:
\begin{equation}
BER = Q(\frac{log_{12}(sf)}{\sqrt{2}} \frac{E_b}{N_0} )
\end{equation}
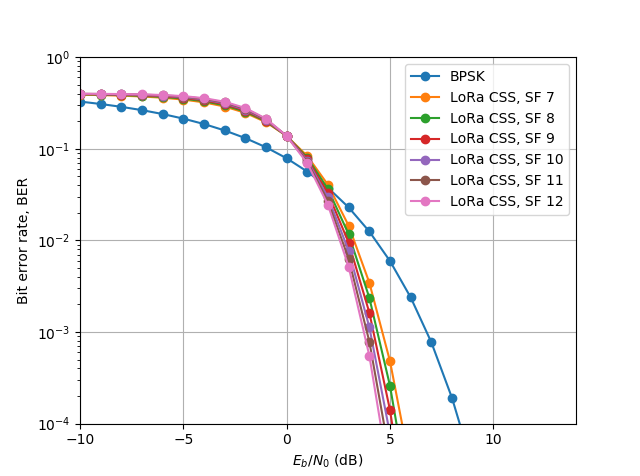
where $Q(x)$ is the Q-function. Authors also show some results comparing the BER for a LoRa CSS system with a BPSK system. If useful, I have reproduced the results:
 My question is related to the conversion from $E_b/N_0$ to $SNR$. This is something I have done many times (a very useful resource to relate these two metrics can be found here), but results from such conversion are a bit confusing to me.
The general expression (in dB) that relates $SNR$ and $E_b/N_0$ is:
\begin{equation} SNR(dB) = {E_b}/{N_0} + 10\cdot log_{10}(R_s) + 10\cdot log_{10}(k) + 10\cdot log_{10}(R) - 10\cdot log_{10}(BW_n) \end{equation}
where $R_s$ is the symbol rate; $k$ is the number of information bits per symbol, $R$ is the code rate and $BW_n$ is the noise bandwidth.
Say for an uncoded 2PSK system (R=1), k is 1, and if considering matched transmit and receive filters, $Rs = BW_n$, then $SNR = E_b/N_0$.
Now, I am confused with LoRa CSS. Let's consider there is no FEC either (R again is 1). To my knowledge, the number of information bits per symbol, $k$, is $k = log_2(2^{sf}) = sf$; and the symbol rate, $R_s$, is $R_s=BW/2^{sf}$, where $BW$ is one of LoRa's bandwidths (e.g., 125kHz, 250kHz or 500kHz).
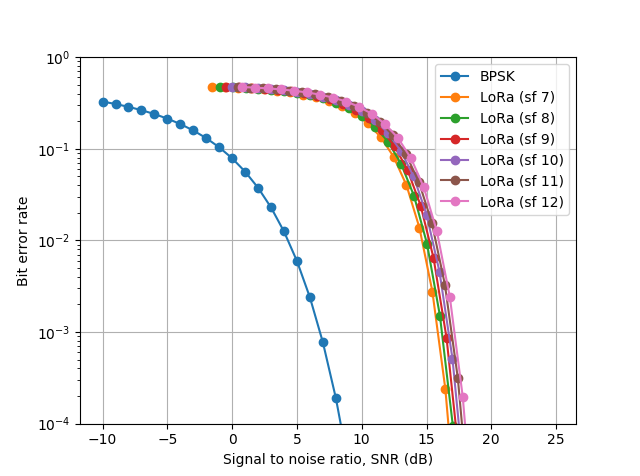
Could I take the same consideration regarding matched transmit and receive filters? If so, $Rs = BW_n$, and this would yield the following expression (in dB): $SNR = E_{b}/N_{0} + 10\cdot log_{10}(sf)$. The figure below shows the BER versus SNR using such expression, and I am not sure if they make sense:
Okay, say now that I do not consider matched transmit and receive filters. The equation for calculating SNR would be (R = 1):
\begin{equation} SNR(dB) = {E_b}/{N_0} + 10\cdot log_{10}(BW/2^{sf}) + 10\cdot log_{10}(sf) - 10\cdot log_{10}(BW_n) \end{equation}
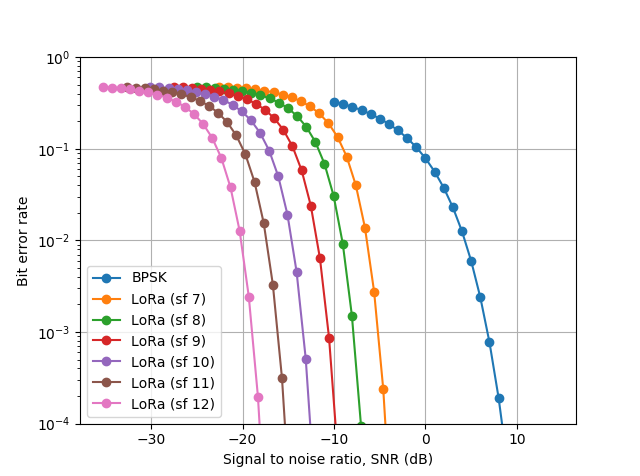
What would be the value of $BW_n$? Can I consider the same as BW (e.g., 125kHz)? If so, I got the following results:
Is this okay? What am I doing or considering wrong? I would appreciate if anyone could shed some light in what I am doing.
Thanks
If useful, I generated the previous figures on python, and the code is:
from __future__ import division
from numpy.random import rand, randn
import numpy as np
import matplotlib.pyplot as plt
import scipy.special
import math

qfunc = lambda x: 0.5 * scipy.special.erfc(x/np.sqrt(2))

sf_range = [7,8,9,10,11,12]
EbN0dB_range = range(-10,15)

itr = len(EbN0dB_range)
itr_sf = len(sf_range)

## BPSK
bpsk_ber = [None for _ in range(itr)] # BER
bpsk_SNR_dB = [None for _ in range(itr)]  # Signal to noise ratio in dB
bpsk_M = 2               # Modulation Order
bpsk_k = np.log2(bpsk_M) # No of bits per symbol (BPSK is 1 bit per symbol)
bpsk_Rfec = 1
bpsk_Rs = 1
bpsk_BWn = 1  # Noise bandwidth

## LoRa
lora_ber = [[None for _ in range(itr)] for _ in range(itr_sf)]
lora_SNR_dB = [[None for _ in range(itr)] for _ in range(itr_sf)]  # Signal to noise ratio in dB
lora_Rs = [None for _ in range(itr_sf)]
lora_Rb = [None for _ in range(itr_sf)]
lora_Rfec = 1
lora_bw = 125e3
lora_BWn = 125e3

for s in range (0, itr_sf):
  sf = sf_range[s]
  lora_Rs[s] = ( lora_bw / ( 2 ** sf ) )
  lora_Rb[s] = lora_Rs[s] * sf

for n in range (0, itr):
  EbNOdB = EbN0dB_range[n]

  # For a matched-filter BPSK system, BWn = Rs
  bpsk_SNR_dB[n] = EbNOdB  + 10 * np.log10(bpsk_Rs) + 10 * np.log10(bpsk_k) + 10 * np.log10(bpsk_Rfec) - 10 * np.log10(bpsk_BWn)

  EbN0 = 10.0 ** (EbNOdB / 10.0)
  bpsk_ber[n] = qfunc(np.sqrt(2 * EbN0)) # or ber[n] = Pb(np.sqrt(EbN0))

  # LoRa
  for s in range (0, itr_sf):
    sf = sf_range[s]

    # Convert EbN0 to SNR
    # We consider matched transmit and receive filters (lora_Rs == BWn)
    lora_SNR_dB[s][n] = EbNOdB + 10 * np.log10(sf)
    # lora_SNR_dB[s][n] = EbNOdB + 10 * np.log10(lora_Rs[s]) + 10 * np.log10(sf) + 10 * np.log10(lora_Rfec) - 10 * np.log10(lora_BWn)
    # Calculate BER for LoRa CSS
    lora_ber[s][n] = qfunc(( log12(sf) / np.sqrt(2) ) * EbN0)

plt.figure()
plt.plot(EbN0dB_range, bpsk_ber, '-o', label='BPSK')
for i,b in enumerate(css_ber):
  plt.plot(EbN0dB_range, b,'-o', label='LoRa CSS, SF {}'.format(sf_range[i]))
axes = plt.gca()
axes.set_xlim([EbN0dB_range[0], EbN0dB_range[-1]])
axes.set_ylim([1e-4, 1e-0])
plt.xscale('linear')
plt.yscale('log')
plt.xlabel('$E_{b}/N_{0}$ (dB)')
plt.ylabel('Bit error rate, BER')
plt.grid(True)
plt.legend(loc = 'best')

plt.figure()
plt.plot(bpsk_SNR_dB, bpsk_ber, '-o', label='BPSK')
for i,b in enumerate(lora_ber):
    plt.plot(lora_SNR_dB[i], lora_ber[i], '-o', label='LoRa (sf {})'.format(sf_range[i]))
axes = plt.gca()
axes.set_ylim([1e-4, 1e-0])
plt.xscale('linear')
plt.yscale('log')
plt.ylabel('Bit error rate')
plt.xlabel('Signal to noise ratio, SNR (dB)')
plt.grid(True)
plt.legend(loc = 'best')
plt.show()


