8
$\begingroup$

So I have a unique challenge. I want to take an audio file, and pick out the peaks in the samples and plot that onto a graph. Each point based on the amplitude/pitch(?) will be represented as either a small dot (lower amplitude) or a bigger dot (higher amplitude).

So if I had to look at a drum track, I should notably see big dots where the drum is hit, but smaller dots when a cymbal is hit.

From a technology stack perspective, I am using Python - and using a Library called Aubio (although I am not sure if there is a better library out there).

EDIT:

Forgive me on the lingo - very new at this audio stuff. Okay so the issue I have currently is that I have a waveform graph that shows the samples over time using a standard sampling technique.

But I found an article on Peak detection, which is exactly what I am looking for (I think).

The challenge I have now is pulling those peak values out via Python and Aubio and plotting them on a Graph.

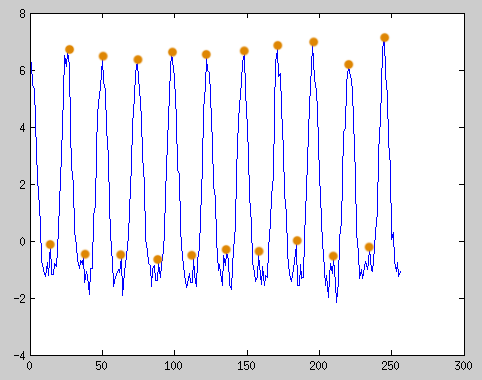
enter image description here

$\endgroup$
6
  • 1
    $\begingroup$ Hi! Welcome to signals.SE; this is a bit hard to answer, because you (ab)use the word "frequency" for different things. Because of that (or maybe, because I'm generally a bit of a confused person), I simply don't get the picture you're aiming for. So, we need to clarify first: "peaks in the frequencies" <-- I think you might be thinking of maxima in a power spectral density (PSD) plot? Can you confirm that? "Each point based on the frequency" <-- you mean you arrange points on an axis that means "higher frequencies to the right, lower frequencies to the left"? your "bigger"/"lower" … $\endgroup$ Commented May 9, 2017 at 8:49
  • $\begingroup$ … notation isn't clear, either: you mean "higher frequency" (as in: 10 kHz is higher than 100 Hz), or do you mean "higher amplitude at that frequency" (as in: the sound at 100 Hz is much louder than the one at 10 kHz). What is a "symbol" in this context? $\endgroup$ Commented May 9, 2017 at 8:51
  • $\begingroup$ Hi, thanks for the questions. Please see above edit I made to the post. In essence I am trying to create the following link (orange dots when peaks happen) $\endgroup$ Commented May 9, 2017 at 10:54
  • $\begingroup$ Drums and cymbals don't really have a frequency or pitch. Are drums and cymbals the only thing you need to detect? Are they always from the same drum kit? $\endgroup$
    – endolith
    Commented May 9, 2017 at 13:36
  • $\begingroup$ I am using a STEMS file, which has different tracks embedded into one 1 (Drums on a different track to bass, separate to melody, etc). What I found so far is that if I use peak detection, I might be able to represent the output the way I need it link Just need to figure out how I do that in Python. $\endgroup$ Commented May 9, 2017 at 13:50

1 Answer 1

9
$\begingroup$

I found the answer finally. I found a great article that explains many different libraries that can be utilized for peak detection. I now have the peaks I am really interested in, and can now create the output I am requiring.

Finding Peaks in Python

$\endgroup$

Your Answer

By clicking “Post Your Answer”, you agree to our terms of service and acknowledge you have read our privacy policy.

Not the answer you're looking for? Browse other questions tagged or ask your own question.