1
$\begingroup$

It has been so long since I studied this at University, so I'll better ask here if I'm doing something really wrong here.

I'm using a USRP frontend for L1 band surveillance. I want a 20MHz bandwidth, but I found through testing that it's better to use a sampling frequency slightly higher than twice that bandwidth (I'm using 41MHz), so I can use a local oscillator to move the DC out of the spectrum. Probably there is some additional error of concept here, but this isn't the problem I'm facing now.

First thing to note: I'm using an FFT over a big chunk of data. Depending on the configuration this size may vary, but for example I'm currently using 8192 samples per FFT. Maybe this is too much and I should compose the whole FFT using many smaller ones, somehow?

In order to reduce noise, I'm performing 100 of these FFTs, summing their outputs and dividing by 100. Probably there's a better method, but so far ok.

After I apply the FFT (with FFTW library), I convert the output to dBW/Hz with the following formula (I'm assuming I have Vpeak):

10 * log10(psd_output / (2 * 50 Ohm)) - 60

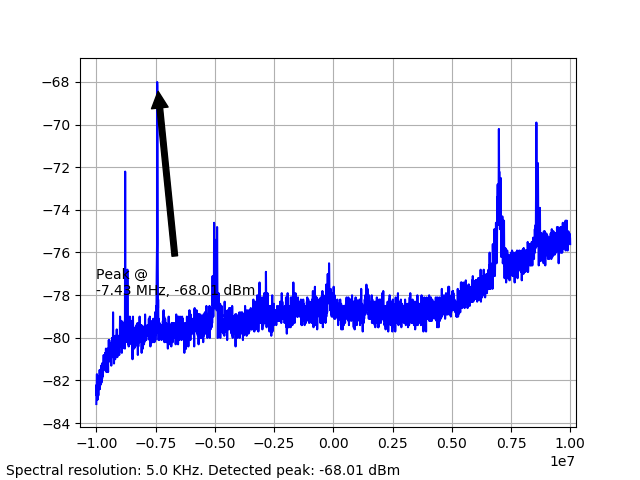
Now, if I plot this vector, I get something like this: PSD example
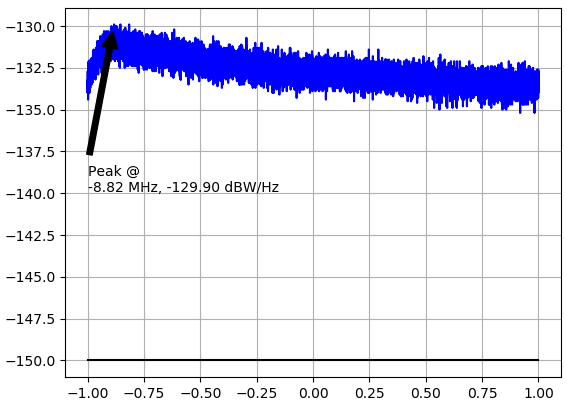
The noise floor is getting some curvation (up to 5 dBs). I tried applying a hamming or a blackman-harris window to the FFT output with the hope or removing this effect, but it didn't work.

If I test with a jammer, I can see the peak, but I also see some other minor peaks which are unwanted (and that are not seen in an spectrum analyzer with the same configuration): Another example

What am I missing? These should be simple operations, but I'm out of ideas at this point.

EDIT: Adding other plot Third example

$\endgroup$
7
  • $\begingroup$ I have not worked with radio signals before, but could it be that the Nyquist criterion is violated? It is important that the sampling rate is higher than the highest frequency in the signal, which is not necessarily equivalent to the signal's bandwidth. Doesn't the L1-band have a carrier frequency in the GHz range? You're probably doing the demodulation, but I thought I just ask. $\endgroup$
    – applesoup
    Commented Feb 8, 2018 at 9:31
  • $\begingroup$ @applesoup most USRP devices come with a down/upmixer, and work in complex baseband with dual (IQ) ADC, so Nyquist reduces to once the signal bandwidth. Roman, which USRP exactly are you using? Only a few USRPs actually support sampling rates like 41 MHz, that's why I ask. $\endgroup$ Commented Feb 8, 2018 at 9:47
  • $\begingroup$ @applesoup I might be wrong, but I think that it's not like that: my carrier is the central freq of the L1-band, where I want to sample 20MHz of the spectrum (thereof, that's why I use at least 20MHz of sampling freq at least). I use 41MHz of sampling freq, get 41MHz bandwidth and later cut the spectrum to my desired 20Mhz. Is that wrong somehow? $\endgroup$
    – Roman Rdgz
    Commented Feb 8, 2018 at 9:48
  • $\begingroup$ @Marcus Müller I'm using the mini205i, isn't it ok for that sampling rate? I'm also using a rxgain of 40dB, in case the curve is due to that somehow $\endgroup$
    – Roman Rdgz
    Commented Feb 8, 2018 at 9:51
  • 1
    $\begingroup$ @MarcusMüller I don't mind that I can't see GPS: the problems are (1) that curve over the noise floor (maybe because I ask the USRP for rx_bandwidth EQUAL to rx_rate?) and (2) the undesired peaks when I expected to see a flat noise floor, just like the one I see in a spectrum analyzer. Those peaks are too high to let me set a reasonable threshold to detect interferences, specially if they are in the upper zone of the 'curved spectrum'. See third example I just added. Does that seem normal? $\endgroup$
    – Roman Rdgz
    Commented Feb 8, 2018 at 10:22

3 Answers 3

1
$\begingroup$

Does the 'same configuration of your analyzer' mean the 'same sampling rate'? Is that equal to 41 MHz? It looks like you faced a well-known problem with a Nyquist criterion practical implementation. I mean that some time ago in digital oscilloscope ads there was an exact Nyquist ratio between a sampling rate and channel bandwidth (especially for cheap ones). Now it is about 10. (You may want to look at any ads of digital oscilloscopes) I remember there were several articles with figures similar to those posted here. To check this hypothesis just check a sampling rate of your spectrum analyzer (you wrote that artificial pikes are not seen in a spectrum analyzer with the same configuration.) or try to use a higher sampling rate in your data processing procedure if possible. In order to get at least an intuitive idea of the reason lies in the foundation of the problem perhaps you want to check this: Why is it a bad idea to filter by zeroing out FFT bins? I suppose the following paragraph from the cited answer works for you: 'So if your original FFT input data is a window on any data that is somewhat non-periodic in that window (e.g. most non-synchronously sampled "real world" signals), then those particular artefacts will be produced' This phenomenon is called resolution bias error, or more commonly, the picket fence effect http://www.azimadli.com/vibman/thepicketfenceeffect.htm. Here you can find an illustration http://www.mechanicalvibration.com/More_on_spectral_leakge.html

$\endgroup$
1
$\begingroup$

From experience, the spectrums as shown appear to me to part of the signal as received or as processed in the receiver and exist in the waveform just prior to computing the DFT from the receiver or other sources. These are likely not an artifact of any particular processing done by the OP with the DFT itself.

The OP has mentioned that he does not see this on a spectrum analyzer, but is the spectrum analyzer measuring the same signal at the closest possible point just prior to the ADC (and is the DFT being performed on the samples just after the ADC)? And is there sufficient low noise gain added in front of the spectrum analyzer (with a flat gain response) since the spectrum analyzer's own noise is typically at best 20 to 30 dB above the noise floor--- when measuring with a spectrum analyzer always ensure that the noise floor overall increases when you connect to your device being measured, otherwise there is insufficient gain to see the actual noise floor. Barring all that, then there are multiple opportunities in between the spectrum analyzer measurement and the DFT where such actual noise and frequency shaping can be introduced.

If this is measurement from a GPS antenna, it is common to see a peak in the noise floor on the order of 15 MHz wide or so due to the combination of the amplifier and filter is an active antenna is used. Again if there is insufficient gain at the spectrum analyzer this may not be visible, while after further processing in the receiver prior to the DFT such gain may well be provided to show all sorts of spectral contamination.

$\endgroup$
0
$\begingroup$

Make sure you are summing your FFTs correctly. You need to convert each complex bin to magnitude^2 before summing , and then add all the powers together, divide by N, then take the square root (or 10*log10() if you want dB). If you are adding FFTs in the complex domain then the results will be incorrect.

$\endgroup$

Your Answer

By clicking “Post Your Answer”, you agree to our terms of service and acknowledge you have read our privacy policy.

Not the answer you're looking for? Browse other questions tagged or ask your own question.